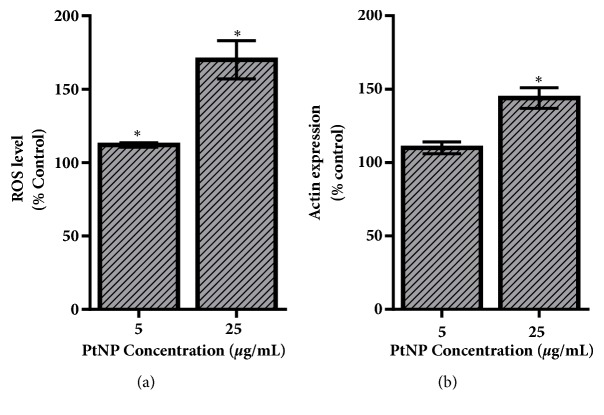
Figure 3.
PtNP-induced stress response within the HepG2 cell model. (a) ROS and (b) actin levels were measured within HepG2 cells following a 24-hour exposure to varying dosages of PtNPs. Both endpoints demonstrated a dose-dependent increase in stress activation. Data represents 3 independent trials with ∗ denoting statistical significance from untreated controls (p < 0.05).

