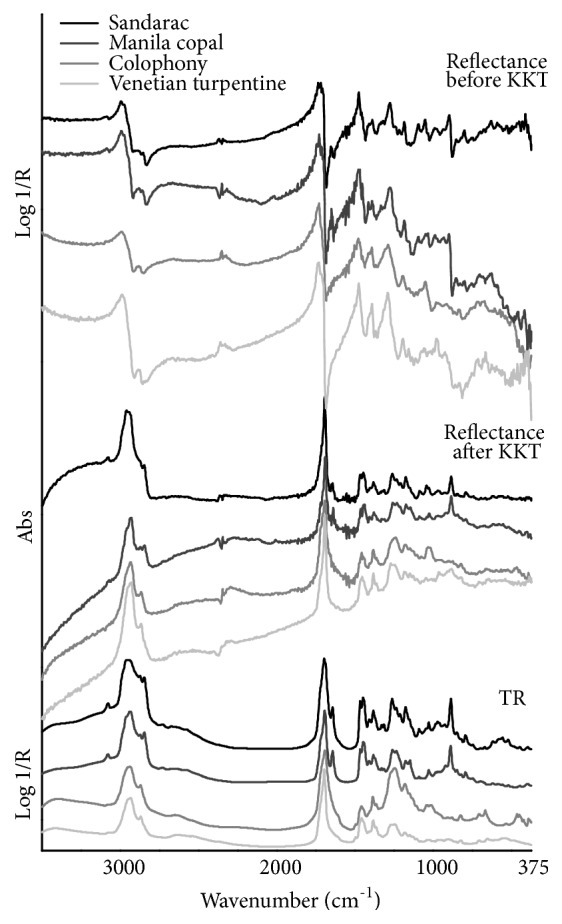
Figure 6.

FTIR spectra in the mid-infrared region of the studied diterpenoid resins (black line: sandarac, dark gray line: Manila copal, gray line: colophony, light gray line: Venetian turpentine) using different analysis modes. From top to bottom: total reflection mode before the KKT correction, total reflection mode after the KKT correction, and transflection mode.
