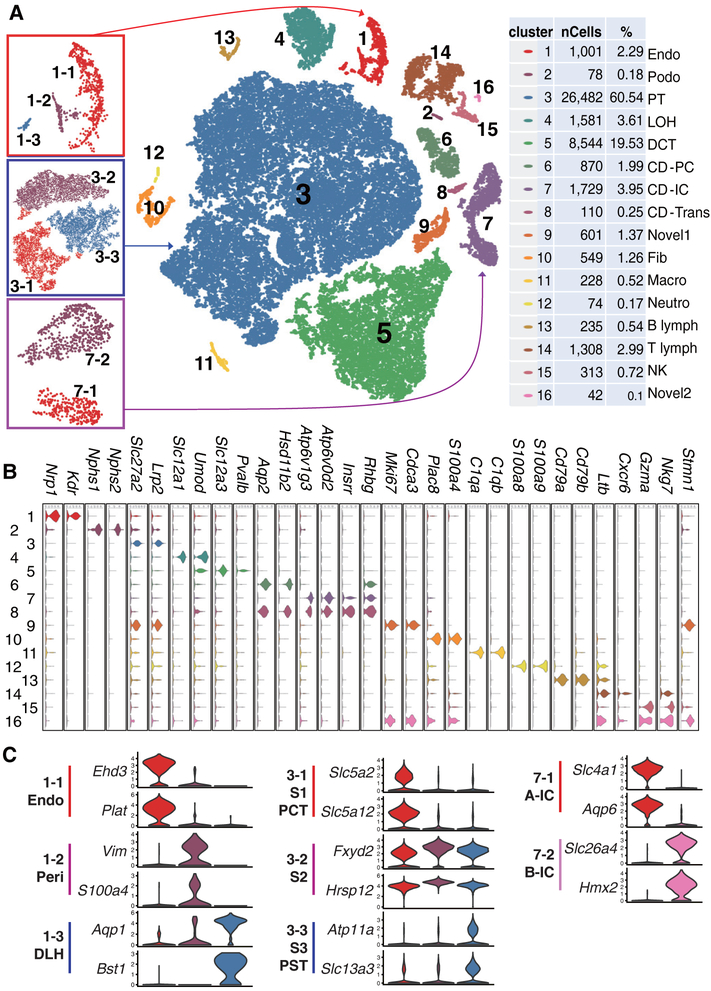
Fig. 1. Cell diversity in mouse kidney cells delineated by single cell transcriptomic analysis.
(A) Unsupervised clustering demonstrates 16 distinct cell types shown in a tSNE map. Left panels are subclusters of clusters 1, 3, and 7. Percentage of assigned cell types are summarized in the right panel. Endo: containing endothelial, vascular, and descending loop of Henle, Podo: podocyte, PT: proximal tubule, LOH: ascending loop of Henle, DCT: distal convoluted tubule, CD-PC: collecting duct principal cell, CD-IC: CD intercalated cell, CD-Trans: CD transitional cell, Fib: fibroblast, Macro: macrophage, Neutro: neutrophil, NK: natural killer cell. (B and C) Violin plots showing the expression level of representative marker genes across the 16 main clusters. Y-axis is log scale normalized read count. (C) Cluster1 (from panel A left) separates into endothelial cells, pericytes/vascular smooth muscle cells and descending loop of Henle (DLH). Cluster3 (proximal tubules) separates into S1, S2 and S3 segments or PCT (proximal convoluted tubules) and PST (proximal straight tubules). Cluster 7 intercalated cells separates into A and B type intercalated cells.

