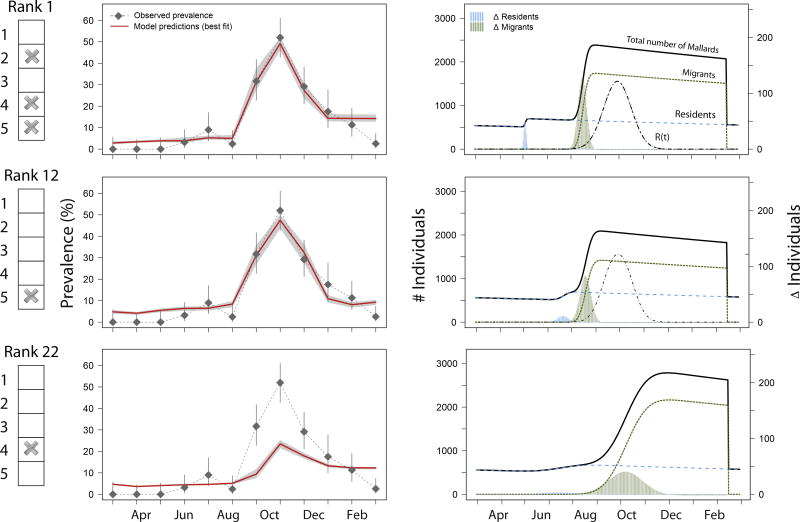
Figure 3.
Results of three model scenarios: the best-ranked scenario (with 3rd, 4th and 5th modification, Rank 1), the scenario with the most influential modification only (5th modification, Rank 12), and the scenario with the second most influential modification only (4th modification; Rank 22). The left column shows which of the model modifications were included in the respective scenario. The middle column shows the observed AIV prevalence levels (±95% CI) at the study site (dashed line with diamond symbols), and the model prediction (bold line) of the best fitting model with the respective modifications. Grey area around model predictions indicate the sensitivity range of the fit (e.g. ±95% CI). The underlying demography for each depicted scenario is shown in the right column with absolute numbers of individuals (black line) consisting of migrants (dotted line) and residents (dashed line). The replaced migrants (R(t)) is also shown as the absolute number of individuals replaced at time t (in days). Additionally, the rate of change in individuals (∆ Individuals) is shown for residents indicating birth (light grey bars) and migrants indicating initial arrival (dark grey bars).

