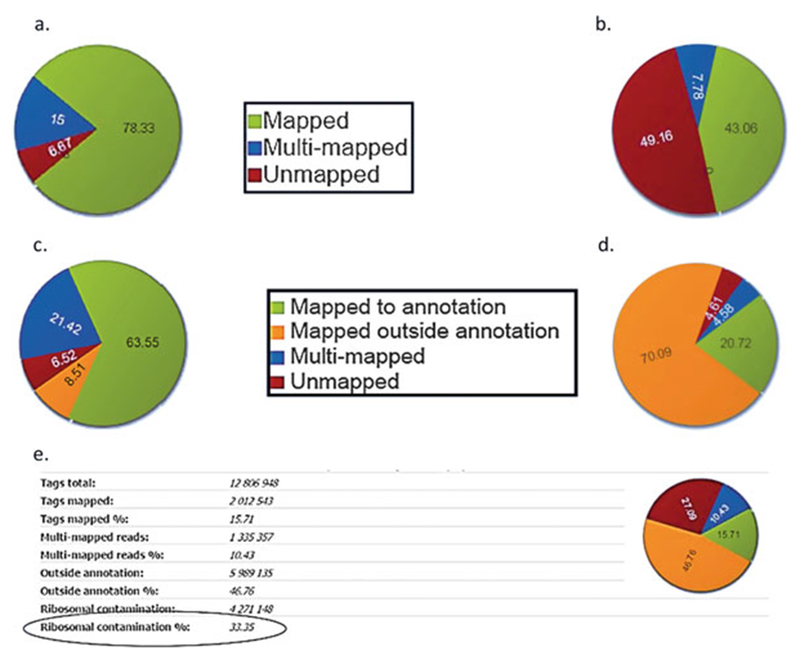
Fig. 1.

Mapping statistics (a) and (b) ChIP-Seq mapping statistics show mapped reads in green, multi-mapped reads in blue and unmapped reads in red. A high percentage of unmapped reads may indicate contamination with adapter dimers—see Fig. 2c. (c) and (d) RNA-Seq mapping statistics shows reads mapped to annotation in green, multi-mapped reads in blue, reads mapped outside annotation in orange and unmapped reads in red. High percentage of reads mapped outside annotation may indicate DNA contamination. (e) Ribosomal RNA contamination: High percentage of reads mapping to rDNA repeat indicate problems with mRNA isolation
