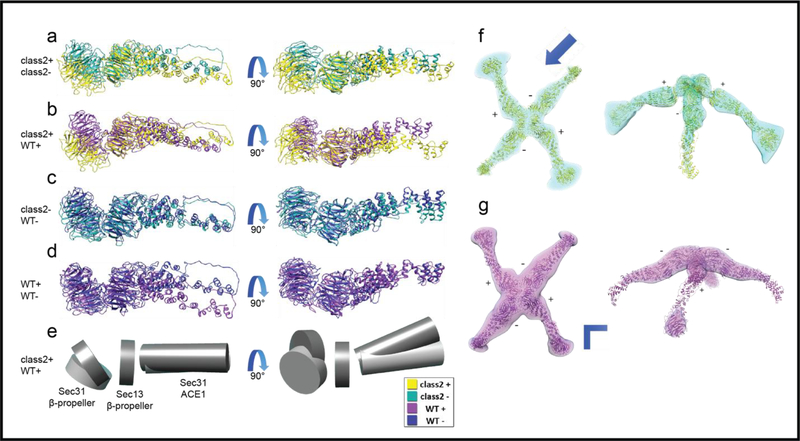
Figure 5.
Flexible fitting of ΔC edge models derived from wt map into ΔC maps. a) Left: superimposition of the plus end dimer (yellow) and the minus end dimer (green) of class 2, with the plane of the figure being the same as the plane which is normal to the four-fold axis of the cage, this view will be called the top view. Right: superimposition of the same dimers with a view perpendicular to the top view, this view will be called the side view. b) Left: superimposition of the plus end of class 2 and the plus end of the wt (purple), top view. Right: superimposition of the same dimers, side view. c) Left: superimposition of the minus end of class 2 and the minus end of wild type (blue), top view. Right: superimposition of the same dimers, side view. d) Left: superimposition of the plus end and the minus end of wild type, top view. Right: superimposition of the same dimers, side view. e) Schematic diagram of the domain shifts that illustrate a new hinge motion between the two β-propeller domains and a new mode of flexibility for the ACE1 domain. The plus-end of class 2 and wt are represented in light grey and dark grey, respectively, with a top view on the left-hand side and a side view on the right-hand side. f) Left: class 2 density and the flexibly fitted ΔC edge model. Right: side view along the arrow’s direction at a lower isosurface threshold. g) Left: class 1 density and the flexibly fitted ΔC edge model. Right: side view along the arrowhead’s direction at a lower isosurface threshold.

