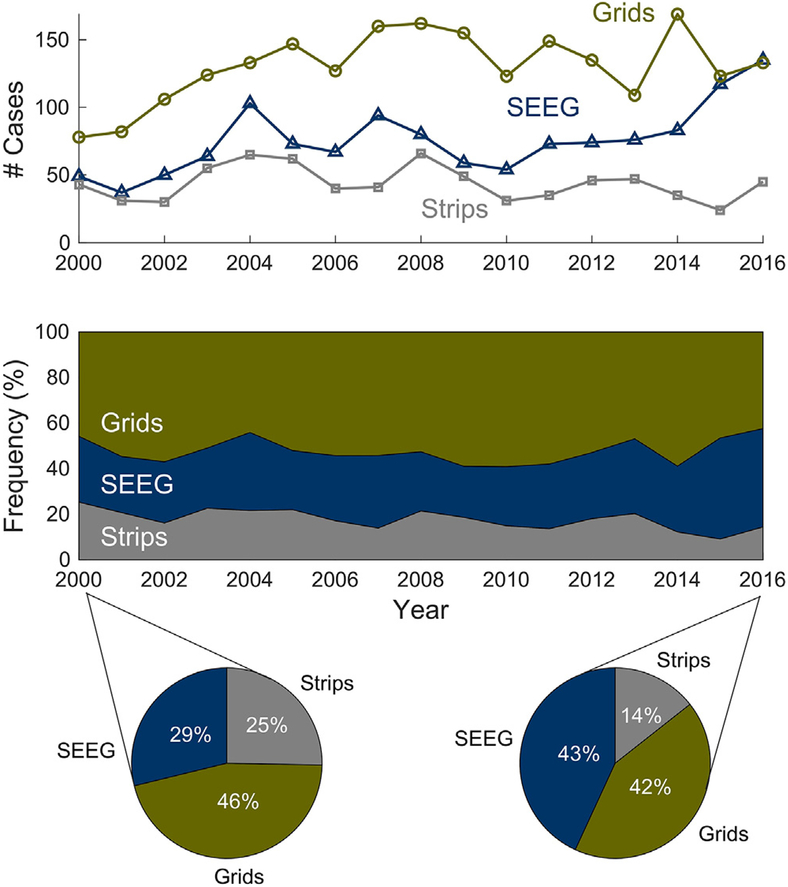
Fig. 1.
Trends in iEEG recordings techniques in the United States using national data from CMS. The top panel shows the number of cases per year and the middle panel shows the frequency of cases per year, both demonstrating that SEEG cases significantly increased from 2000 to 2016, while subdural implantation of only strip electrodes through burr holes declined and craniotomy with subdural implantation of electrode arrays, grids, strips, and/or depth electrodes remained stable. The pie charts depict the proportions of iEEG recordings techniques for the first and last year of the study (2000 and 2016).

