Figure 3.

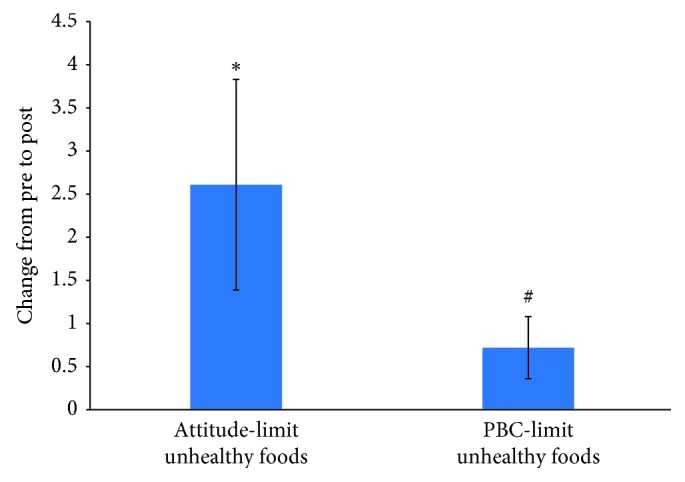
Change in TPB limit unhealthy eating constructs from pre- to post-assessment. Values are mean ± SE, ∗p < 0.05, #p < 0.10.

Change in TPB limit unhealthy eating constructs from pre- to post-assessment. Values are mean ± SE, ∗p < 0.05, #p < 0.10.