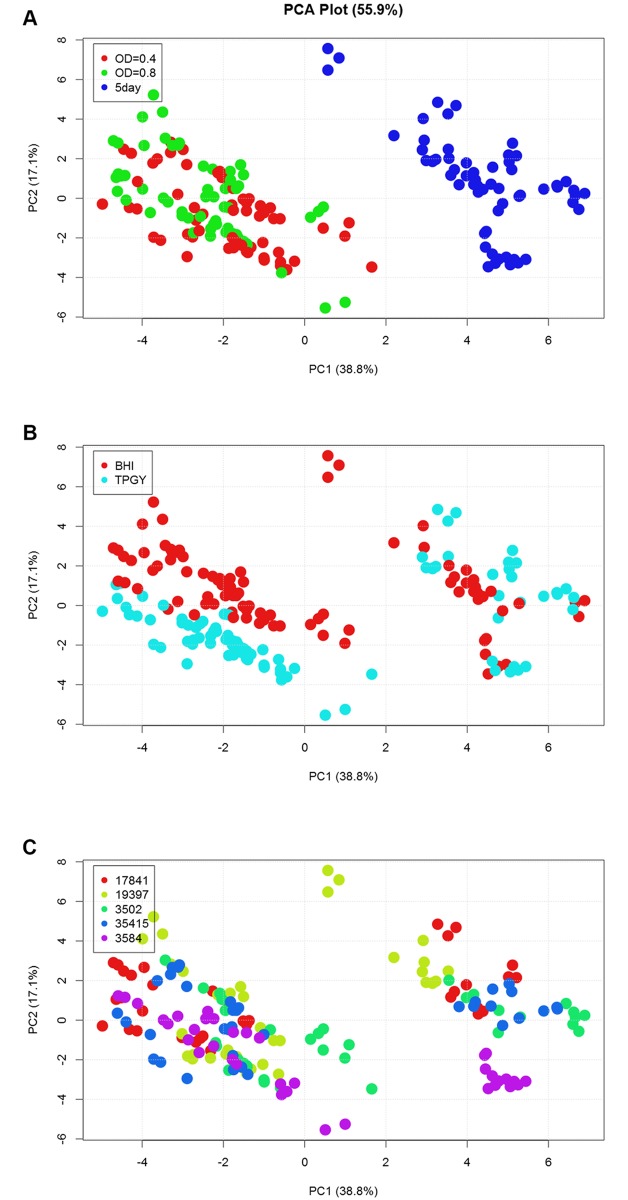
Fig 2. Principal component analysis reveals growth phase as a major factor in protein expression patterns.
Cell mass protein expression data (post-filtering) from all strains, including that at all time points and in both medium types, was analyzed by PCA. (A) Separation on PC1 (x-axis) demonstrates that a major influence on protein expression patterns is the growth phase from which cells were harvested, as datasets from the early time points (OD600 = 0.4 and 0.8; red and green, respectively) segregate from those taken at the late time point (5 days; blue). While samples clearly separate into early and late growth phase “groups” in part (A), (B) medium type shows a slight differentiation in data (mostly from the early time points). A similar grouping is not observed when data are colored by (C) strain identity. The same plot is shown in parts A-C, and has been colored by different factors for visualization.

