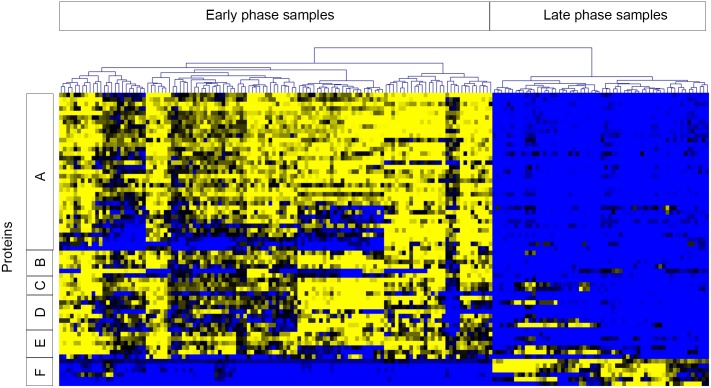
Fig 3. Proteins involved in growth and metabolic pathways are differentially expressed during early and late growth phases.
Expression of proteins from many metabolic pathways/processes in early and late growth phases were significantly different by t-test. For visualization, proteins with significantly different expression profiles from six pathways/processes were selected: A) ribosomal proteins, B) translation/transcription elongation and initiation factors, C) RNA Polymerase subunits and sigma factor, D) tRNA synthetases, E) glycolytic enzymes, and F) enzymes of the glycine reductase system. Clusters A-E demonstrate higher expression during early time points and lower expression during late phase growth, while the reverse is true for cluster F. Data included in this analysis were z-score transformed spectral count values for selected proteins in cell fractions from all strains. Samples are represented across the horizontal axis and proteins along the vertical axis. Clustering of samples across the top separated early and late time point samples as noted. Heat map coloring is from blue (low expression) to yellow (high expression).

