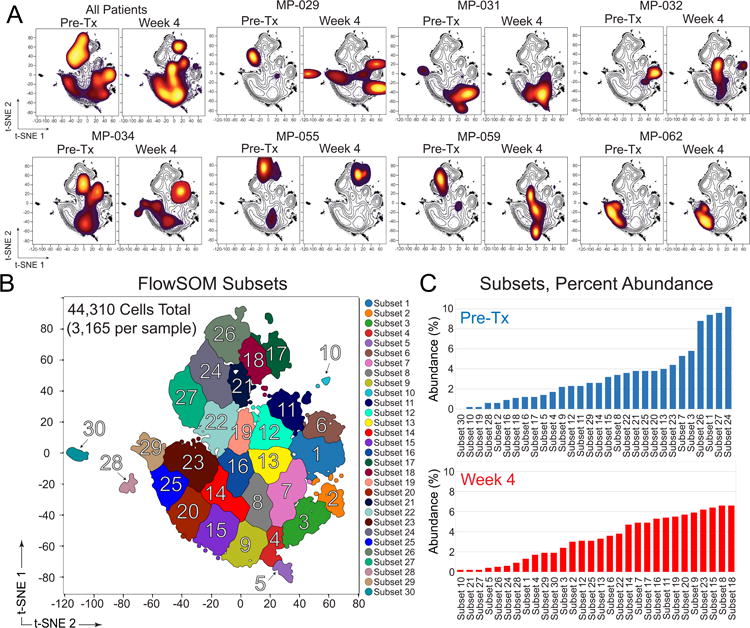
Fig. 3. Combined viSNE analysis of melanoma tumors identifies patient specific changes in tumor phenotype following BRAF and MEK inhibitor treatment.

(A) viSNE density plots show phenotype and abundance of melanoma cells from paired samples of Pre-Tx and Week 4 tumors (N = 7 tumors). A combination viSNE density plot (upper left) shows all patients combined in two plots at Pre-Tx and Week 4. (B) FlowSOM cluster analysis of all patients (Pre-tx and Week 4 combined, as in A) automatically identified phenotypically distinct subsets. (C) Abundance (% of Pre-Tx or % of Week 4 cells) for all subsets identified by FlowSOM is shown, organized from least to most common in Pre-Tx or Week 4 melanoma tumors. Subset labels from (B) and (C) are the same and additional information on patients and subset phenotypes is shown in Supplementary Table S4 and Supplementary Figure S5.
