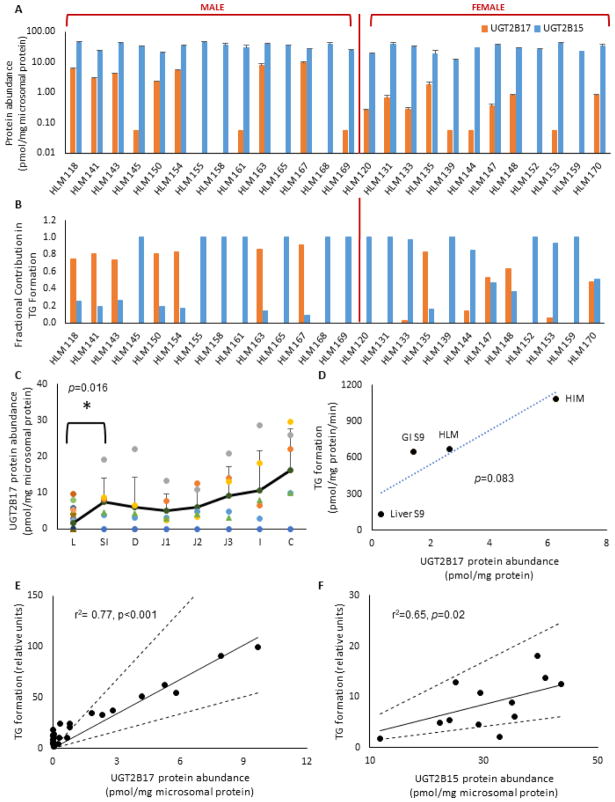
Fig. 1. UGT2B protein abundance and testosterone glucuronidation in human liver and intestinal subcellular fractions.
A. UGT2B17 and UGT2B15 protein abundance in HLM (n=26). 21% (n=6) HLM were confirmed UGT2B17 gene deletions (HLM 152, 155, 158, 159, 165, 168); B. Estimated fractional contribution (fm) of UGT2B17 and UGT2B15 in testosterone glucuronidation in HLM (n=26). fm, UGT2B17 estimates were adjusted to zero for negative values in HLMs with low testosterone glucuronidation activities (n=6). C. UGT2B17 protein abundance (pmol/mg microsomal protein) in human liver microsomes (L, n=26) and donor-matched human intestinal microsomes (n=6) shown as average small intestine (SI), duodenum (D), jejunum (J1, J2, J3), ileum (I), and colon (C). Black solid line shows average values for each group. Average UGT2B17 values for L and SI showed statistically significant difference (p=0.016). 46% of HLM (n=12) and 21% of HIM (n=1) were below lower limit of quantification (LLOQ); D. Correlation between testosterone glucuronide (TG) formation (pmol/ min/ mg microsomal protein) and UGT2B17 abundance (pmol/mg protein) in human liver and intestinal microsomes and S9 fractions; E & F. Correlations between relative testosterone glucuronidation activity in adult HLM and (E) UGT2B17 abundance (n=26) and (F) UGT2B15 abundance in UGT2B17-LLOQ samples (n=12). Solid and dashed lines depict expected and two-fold range values for perfect correlation, respectively.

