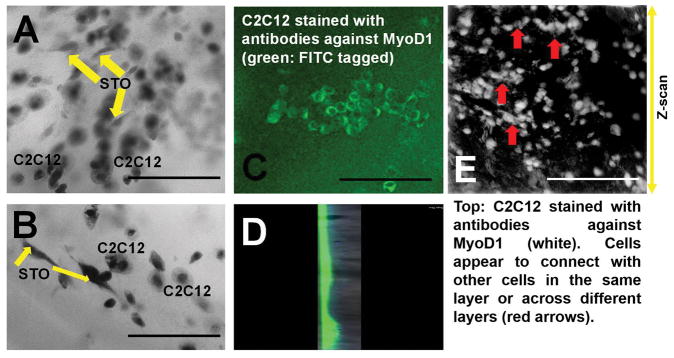
Figure 8.
In A and B, shown are bright field z-scans of STO fibroblasts (elongated spindle shaped) co-cultured with C2C12 myoblasts cells (rounded enlarged, confirmed in C and in E). Scale bar is 150 μm in A, B and 200 μm in C and E. In C, a single plane (cross section) was imaged whereas in E, a Z-scan was run spanning several planes as indicated with the arrow (right hand side). In D, shown is a single slice of z-stack section showing top layer (fluorescent: green for C2C12) and bottom layer (non-fluorescent: STO).

