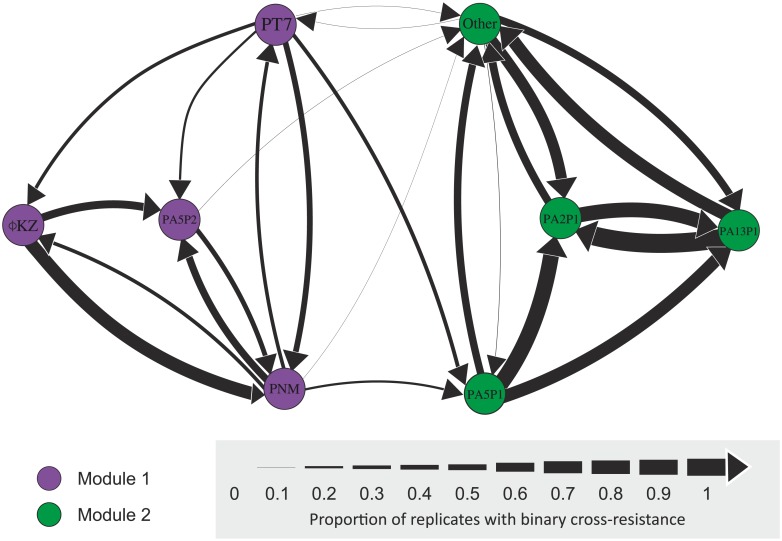
Fig 1. Quantitative cross-resistance network.
Each node represents a phage strain, and arrows between nodes show directional CRF between two phages. The line widths are scaled by the proportion of replicate mutants selected against the focal phage (origin node) that have resistance above the binary threshold (S1 Fig) to the second phage (target node). Node colours define resistance modules identified using an ‘edge-betweenness’ algorithm. A subset of 20 phage strains that all showed strong symmetric cross-resistance were grouped together as the node labelled ‘Other’. CRF, cross-resistance frequency.

