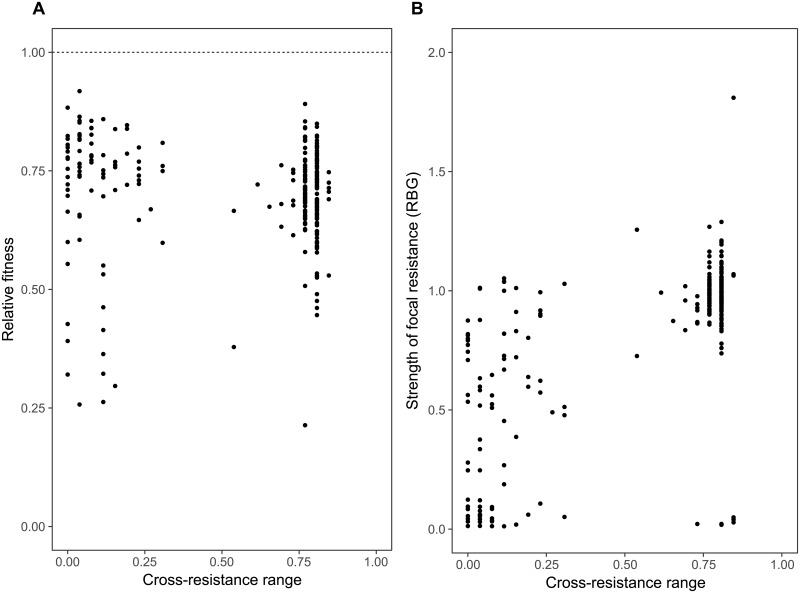
Fig 2. Relationships of cross-resistance range with relative fitness and the strength of focal resistance.
Relationship between cross-resistance range (the proportion of nonfocal phages to which the bacterial mutant has resistance above the binary threshold) and relative fitness of spontaneous resistance mutants (A) measured as growth relative to the ancestral strain in phage-free standard media conditions (raw data provided in S2 Data) and (B) the strength of focal resistance, given as growth in the presence of the phage selected against, relative to growth in the absence of phage (RBG). RBG, relative bacterial growth.

