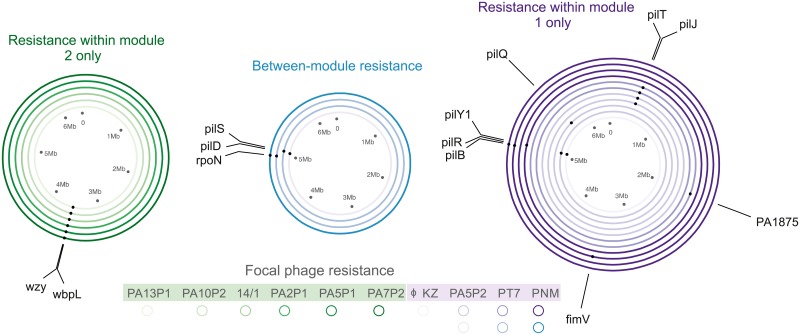
Fig 3. Genetic basis of phage resistance.
Circles represent different phage-resistant mutants selected against different focal phages (indicated by the colour shade; see key), and dots on each circle show the position of mutated genes. Colour represents the cross-resistance profile of each sequenced resistant mutant: resistance within module 1 (purple), within module 2 (green), and between modules (generalist resistance, blue).

