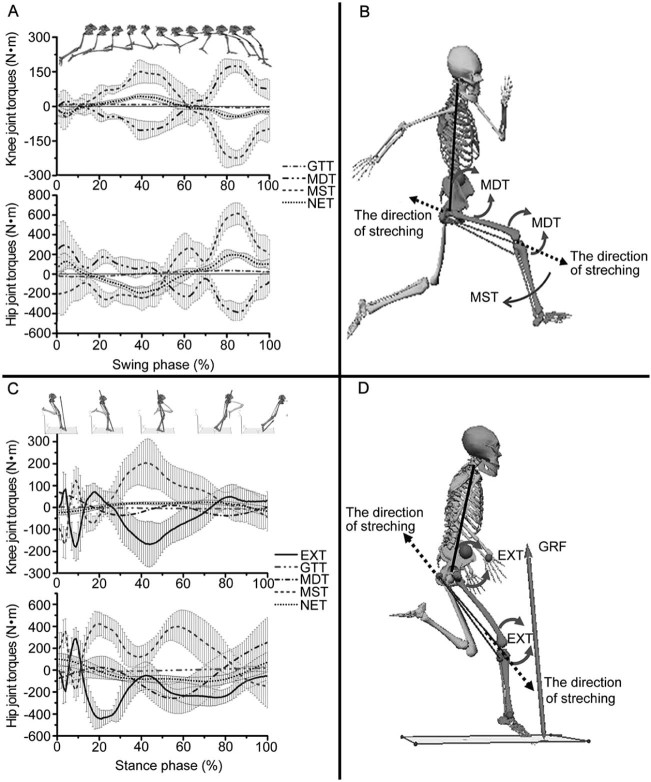
Fig. 1.
Averaged time-normalized graphs for joint torques at knee and hip joints during the swing (A) and stance (C) phases of sprinting. The top panels show positions of the lower extremity during the swing (A) and stance (C) phases. Data represent the group mean (lines) with 1SD (shading). (B) Diagram of sprinting during the late swing phase: the inertial loads (MDT) produced by segment motion at the knee and hip joints. (D) Diagram of sprinting during the initial stance phase: the GRF passes anteriorly to the knee and hip joints. EXT = external contact torque; GRF = ground reaction force; GTT = gravitational torque; MDT = motion-dependent torque; MST = muscle torque; NET = net torque. (Positive value indicates extension; negative value indicates flexion.) Adapted with permission.2

