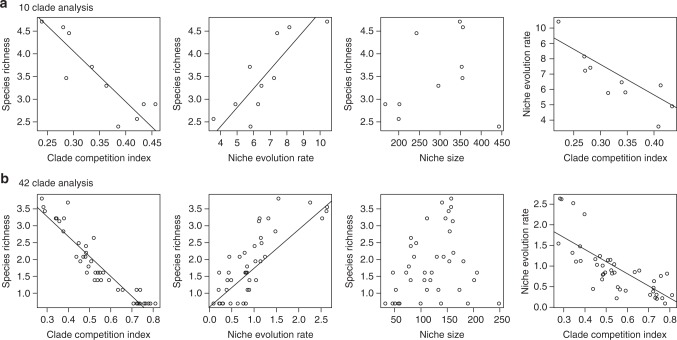
Fig. 2.
Associations between species richness and diversification metrics. Scatter plots between clade species richness and selected clade metrics for two divisions of the conifer phylogeny into a 10 large clades and b 42 smaller clades. Straight lines indicate significant linear effects detected using phylogenetic generalized least squares (PGLS) regressions. The presence of multiple correlations made interpretation difficult; for this reason, we performed a path analysis (Fig. 3)

