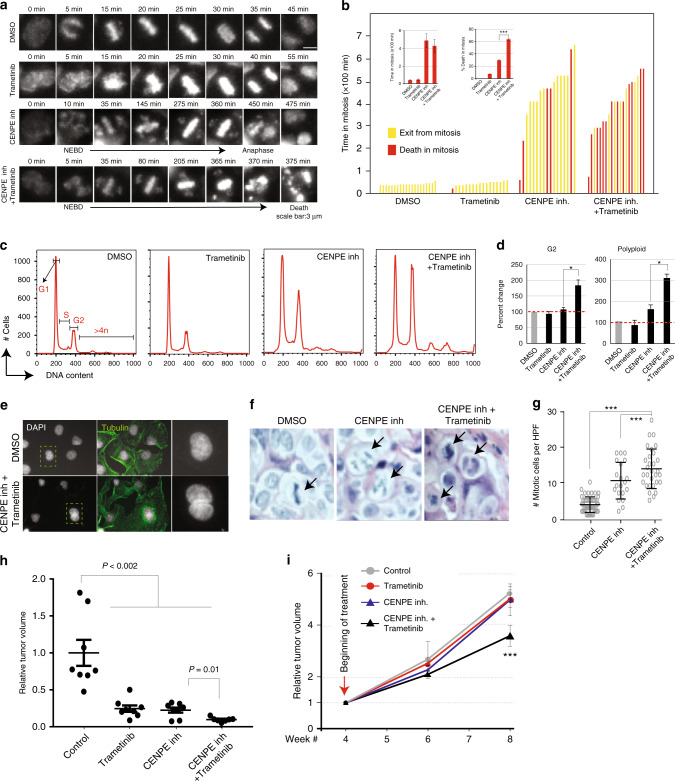
Fig. 3.
Combinatorial MEK and CENPE inhibition results in synergistic cell death. a Each frame represents movie stills from time-lapse longer-term live-cell imaging as cells undergo mitosis starting from nuclear envelope break down (NEBD) to exit from mitosis. b Each bar graph show total time duration of each of the individually tracked cells spent in mitosis. The NEBD was taken as the beginning of mitosis. Individual cells (n = ~20/treatment group) were manually tracked from lime-lapse movies until they exit mitosis (anaphase) or died in mitosis for each of the treatment groups. c Flow cytometry profiles of DNA content in PDX366 PDAC cells treated with control, single-agent, or combinatorial MEK and CENPE inhibitors are shown. d Bar graphs represent treatment-mediated percent changes in cells with 2n (G1), 4n (G2), and >4n (polyploidy) DNA. e Immunofluorescent images of PDX366 PDAC cells treated with control and combinatorial (trametinib and CENPE inhibitors) are shown after DAPI and tubulin staining in the first two left columns respectively. f Representative hematoxylin and eosin (H&E)-stained tumor sections are shown. Tumors were harvested from mice that had undergone 72 h of treatment with 125 mg/kg CENPE inhibitor alone or in combination with 0.3 mg/kg trametinib. Arrows indicate mitotic figures. g Dot-plot showing the number of mitotic cells quantified from 10 different high-power imaging fields (HPFs) per tumor section. h Results show MRI-measured effects of single and combination of drugs on tumor formation. At 1 week after orthotopic implant, mice received control, MEK inhibitor (trametinib), CENPE inhibitor (GSK923295), or combined MEK and CENPE inhibitor. Results show MRI-measured tumor volumes after 4 weeks of treatment. i MRI-measured tumor volumes are shown in mice where tumors were allowed forming for 4 weeks and the treatments (as in e) were started. Beginning of treatment is marked with an arrow. Bounds of the box spans from 25 to 75% percentile, center line represents median, and whiskers visualize 5 and 95% of the data points. Individual data points are marked with circles or dots. Error bars represent the standard error of the mean value of at least three independent experiments. Symbols * and *** denote P < 0.05 and P < 0.001, respectively

