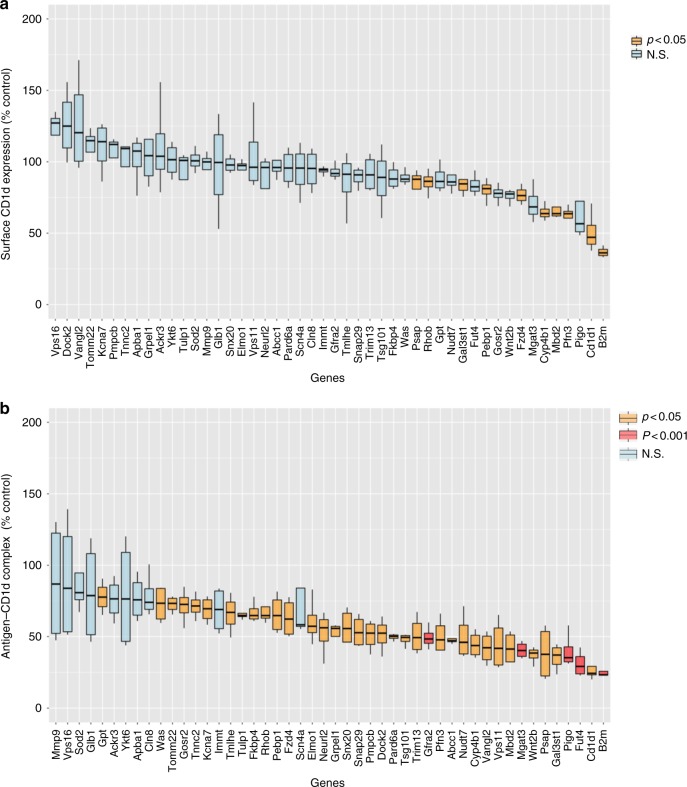
Fig. 4.
Gene knockdown effects on surface CD1d and CD1d-lipid complex formation. a Effect on CD1d surface expression assessed by flow cytometry. The figure represents percentage change in mean fluorescence intensity (MFI) as compared to a non-targeting control. Average value from four experiments is shown. b Flow cytometry analysis of surface expression of αGalCer-CD1d complexes by J774-CD1d cells (live, singlets) after GalGalCer loading. Normalized MFI compared to non-targeting control, the average of four experiments is shown. Boxes represent the interquartile range; maximum and minimum values are displayed with vertical lines. p-Values are indicated (paired t-test). See also Supplementary Fig. 3, 4, 5 and 6

