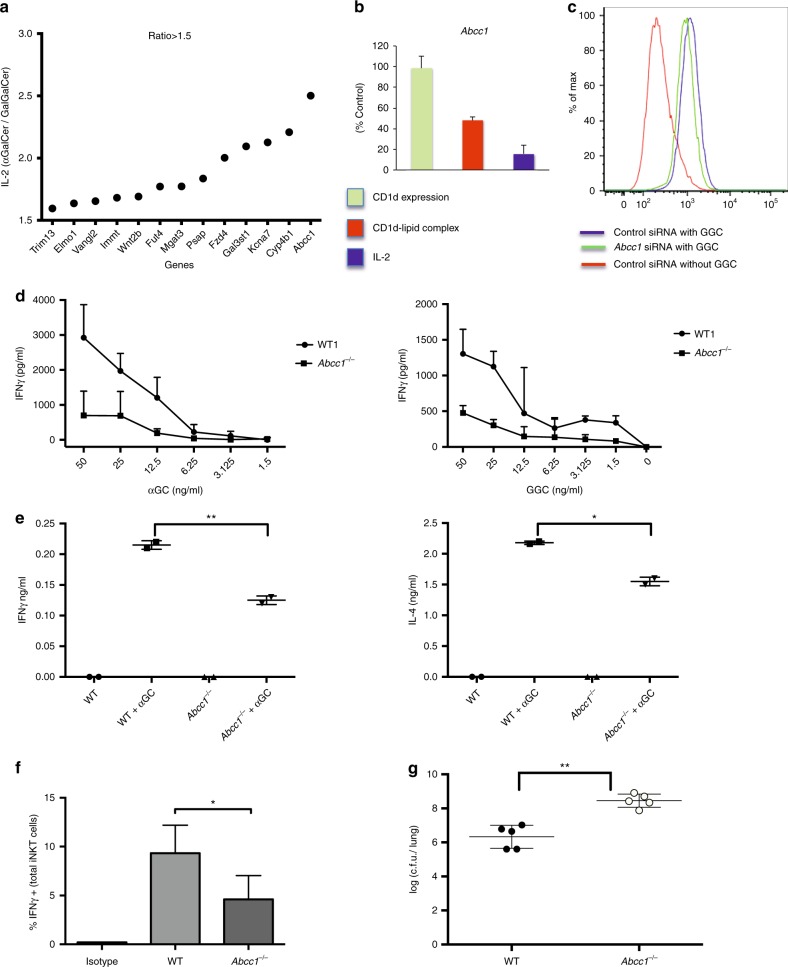
Fig. 8.
Role of Abcc1 in lipid antigen presentation. a After knockdown, J774-CD1d were treated with either αGalCer or GalGalCer and cultured with an iNKT cell hybridoma before measuring IL-2. Figure represents the fold change in IL-2 secretion comparing the normalized response to αGalCer with GalGalCer. Genes that showed >1.5-fold more IL-2 in case of αGalCer are plotted. Figure represents the average of two experiments. b Comparative plots of surface CD1d expression, CD1d-lipid complex formation, and IL-2 release after knockdown of Abcc1 in J774-CD1d cells. Figure represents the average of three experiments. c Figure represents the decrease in surface CD1d-lipid complex expression by J774-CD1d cells after knocking down Abcc1 after loading with GalGalCer. d Peritoneal macrophages were isolated from wild-type (WT) and Abcc1−/− mice, loaded with αGalCer and GalGalCer at the indicated concentrations and incubated with a mouse iNKT cell line before IFNγ measurement. Figure shows the representative plots from one of two experiments. e WT and Abcc1−/− mice were injected i.v. with αGalCer and IFNγ and IL-4 was measured after 2 h of injection. Figure shows the representative plots from one of two experiments. f WT and Abcc1−/− mice were infected with 2.5 × 10⁶ S. pneumonia for 14 h followed by intracellular cytokine staining of gated, lung iNKT cells (See Supplementary Fig. 12). Figure represents the percent IFNγ positive cells in uninfected, and infected WT and Abcc1−/− mice. Figure shows the representative plots from one of two experiments in which pooled cells from two mice for FVB and three mice for Abcc1−/− mice were analyzed. g WT and Abcc1−/− mice were infected with 0.5 × 10⁵ S. pneumonia and after 2 days lung CFU were measured. Data are representative from one of the three experiments. Graphs represent mean ± SD. *p < 0.05; **p < 0.01 (one-way ANOVA). See also Supplementary Fig. 10 and 11

