Fig. 5.
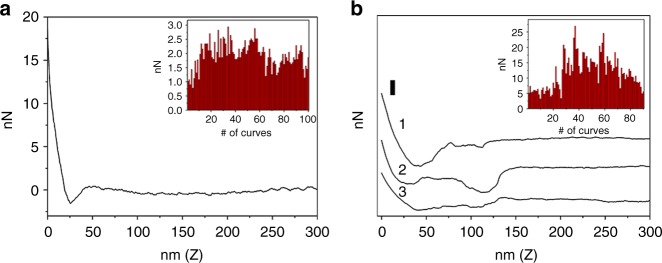
AFM force spectroscopy. a A representative force curve plotted for the interaction between a bare SiO2 spherical tip and a layer of copolymer 3 attached on a Si wafer. The adhesion force histogram for 100 force curves is given in the inset. b Representative force curves plotted for the interaction between a copolymer 3 functionalized SiO2 tip and a layer of LPS attached on a Si wafer and collected before 90 ramp cycles (adhesion forces for curves 1, 2 and 3 are 17.07, 16.36 and 7.10 nN, respectively). The adhesion force histogram before 90 ramp cycles is given in the inset. Scale bar: 10 nN

