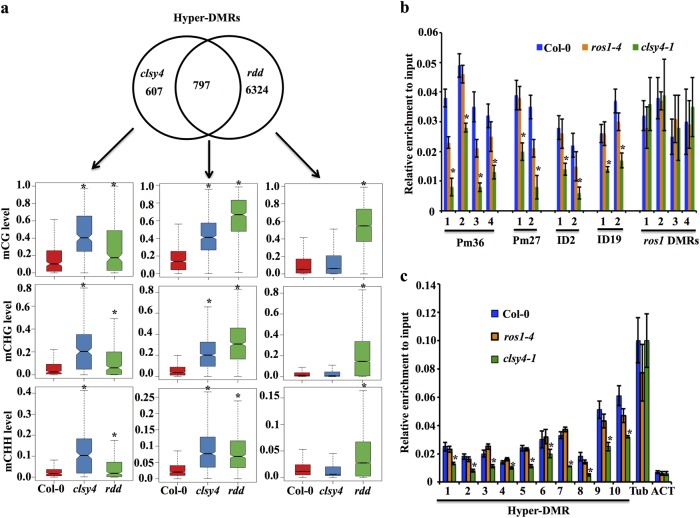
Fig. 2. Features of clsy4 hyper-DMRs.
a Venn diagram showing the overlap of hyper-DMRs between clsy4 and rdd mutants, and box plots showing the DNA methylation levels in three sequence contexts at clsy4-specific, rdd-specific, and overlapped DMRs. *Indicates significant difference by Wilcoxon sum test (P < 0.01). b Nucleosome density indicated by histone H3 levels at the Pm36, Pm27, ID2, and ID19 loci with four rdd-specific hyper-DMRs as controls measured by chromatin immunoprecipitation (ChIP). Bars indicate the standard deviation of three biological replicates. *Indicates statistical difference between the wild type and clsy4 according to Student’s t-test (P < 0.01). c Nucleosome density indicated by histone H3 levels at 10 clsy4 hyper-DMRs measured by ChIP. Tubulin 8 and actin 2 served as controls. *Indicates statistical difference between the wild type and clsy4 according to Student’s t-test (P < 0.01). Bars indicate the standard deviation of three biological replicates

