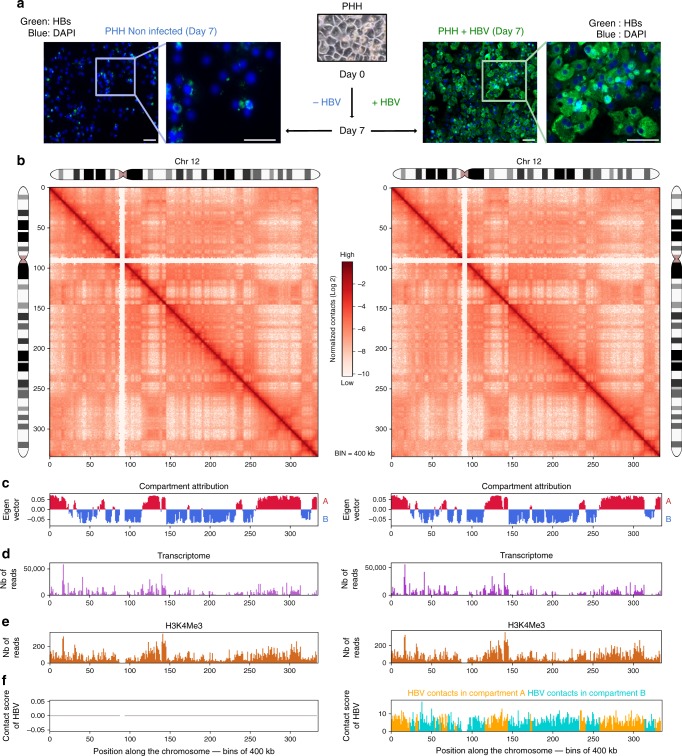
Fig. 1.
Distribution of HBV contacts along the host genome. a HBV envelope proteins (HBs, green) were visualized using immunofluorescence in PHH infected or not by HBV. Scale bar represents 50 μm. b Hi-C contact maps of chromosome 12 from non-infected PHH (left) or from PHH infected with HBV (right) at 400 kb resolution. The color scale represents the normalized contact frequencies between bins. c First principal component of chromosome 12 (400 kb resolution) representing the active A-type (red) and repressed B-type compartmentalization (blue). d Gene expression in non-infected and infected PHH 399 using RNAseq reads. e Active histone mark (H3K4me3) reads density along chromosome 12 (400 kb resolution) in HBV-infected PHH from Tropberger et al.13. f Distribution of HBV contacts along chromosome 12 (400 kb resolution) in infected PHH (right). Contacts with active chromatin (A) are shown in orange and with repressed chromatin (B-type) in green

