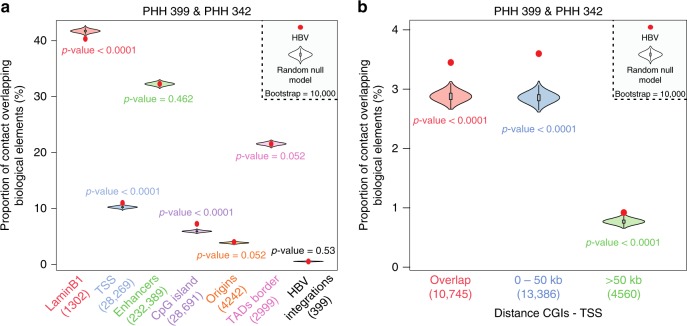
Fig. 3.
HBV genome contacts preferentially CpG-rich regions. a Proportion of HBV contacts with a given biological element (as indicated along with the number of elements) compared with the corresponding null model that shows the distribution using the Hi-C coverage of the corresponding library and represented by violin plot. Density plot width = frequency, line = 95% confidence interval, box plot = interquartile range. Red dot represents the proportion of HBV contacts that overlap with the indicated biological element (computed in windows ± 3.5 kb around the start of the read). p-values were determined according to the percentages detected in the bootstrap strategy (see Methods). b Proportion of HBV contacts with CGIs grouped according to their relative distance to TSS (computed in windows ± 3.5 kb around the start of the read) compared with the corresponding null model that shows the distribution using the Hi-C coverage and represented using the violin plot. Density plot width = frequency, line = 95% confidence interval, box plot = interquartile range. Red dot represents the proportion of HBV contacts that overlap with the indicated biological element (computed in windows ± 3.5 kb around the start of the read). p-values were determined according to the percentages detected in the bootstrap strategy (see Methods)

