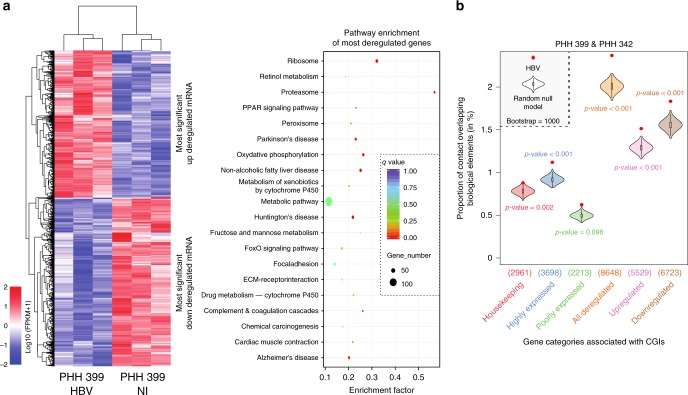
Fig. 4.
HBV contacts are enriched at GCIs associated with highly expressed genes and deregulated genes. a Heatmap of downregulated and upregulated genes in HBV infected PHH 399 compared with mock-infected PHH 399 and KEGG enrichment analysis. b Proportion of HBV contacts that overlap with CGIs present in the promoter of genes pooled according to their functional annotation (as indicated along with the number of elements) compared with the corresponding null model that shows the distribution using the Hi-C coverage and represented by violin plot. Density plot width = frequency, line = 95% confidence interval, box plot = interquartile range. Red dots represent the proportion of HBV contacts with the indicated biological element (computed in windows ± 3.5 kb around the start of the read). p-values were determined according to the percentages detected in the bootstrap strategy (see Methods)

