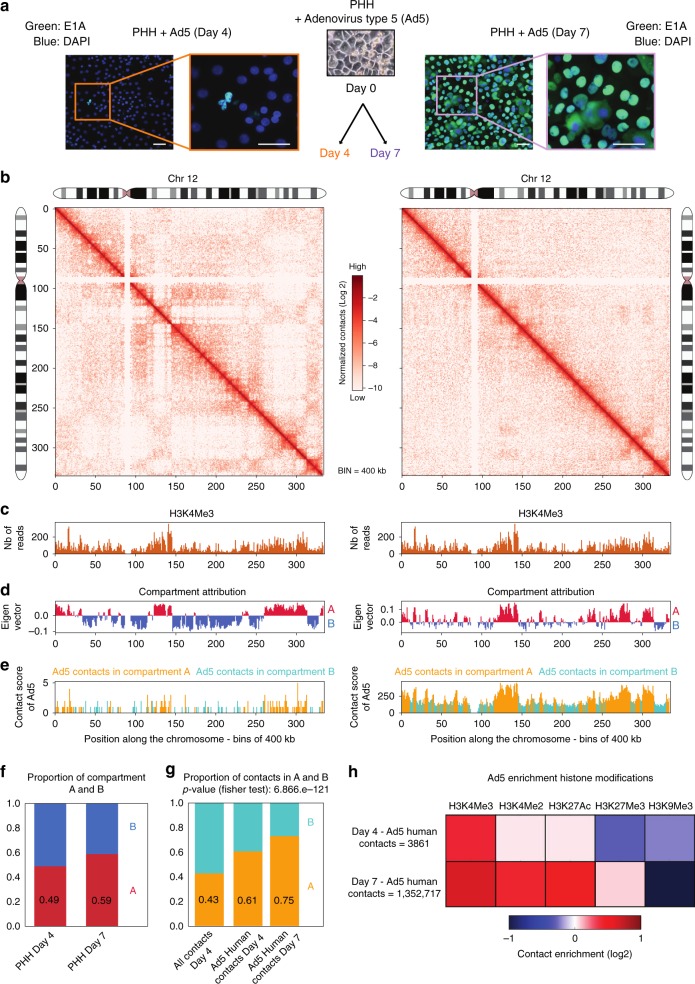
Fig. 7.
Distribution of Ad5 contacts along the host genome. a E1A protein (green) was visualized using immunofluorescence in PHH 345 at day 4 and day 7 p.p. Scale bar represents 50 μm. b Hi-C contact maps of chromosome 12 from PHH infected by Ad5 at 4 and 7 days after plating at 400 kb resolution. The color scale represents the normalized interaction frequencies between bins. c H3K4me3 reads density along the chromosome 12 using dataset from the Encode project generated using hepatic HepG2 cells (400 kb resolution). d First principal component of chromosome 12 (400 kb resolution) representing the active A-type (red) and repressed B-type compartmentalization. e Distribution of Ad5 contacts along chromosome 12 (400 kb resolution) in PHH replication Ad5 4 days (left panel) and 7 days after plating (right panel). f Distribution of active A and inactive B compartments in PHH at 4 and 7 days after plating (400 kb resolution). g Ad5 contacts are enriched in active compartment. Distribution of Hi-C coverage (400 kb resolution) in compartments A and B in PHH at day 4 post plating and distribution of Ad5 contacts on all genomes in PHH 4 and 7 days after plating. p-value was determined using Fisher's test. h Heatmap of Ad5 contacts enrichment on different histone modification marks (computed in windows ± 3.5 kb around the start of the read; N realizations = 100). Signals for the heatmap are represented by fold change (log2 ratio) compared with the average of random groups of contacts. Histone modification marks data were from the Encode project generated using hepatic HepG2 cells (Encode Project:GSE29611)15

