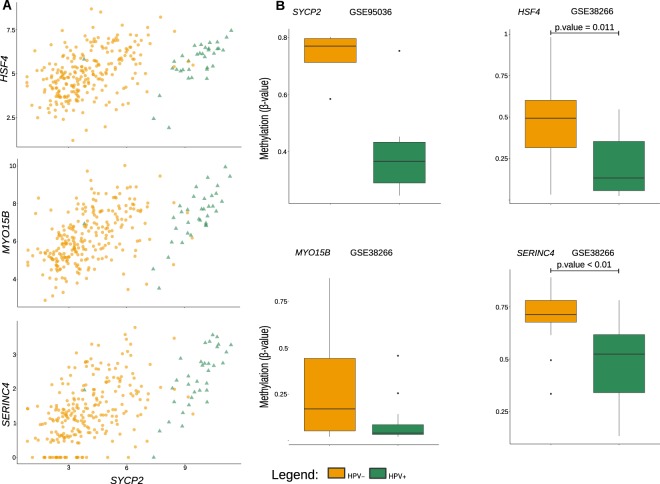
Figure 5.
Comparison of gene expression and promoter methylation data between the TCGA data analyzed and those of independent biological experiments. (A) Scatter plots showing the correlation of expression levels of genes from TCGA data which were differentially methylated (HSF4, MYO15B and SERINC4; y-axes) with SYCP2 (x-axes). The yellow circles represent HPV− samples, while the green triangles represent HPV+ counterparts. (B) Comparison of the methylation levels of the promoter region (TSS200) between HPV+ and HPV− samples in external high-throughput methylation experiments. The adjusted p-values that remained significant are shown.

