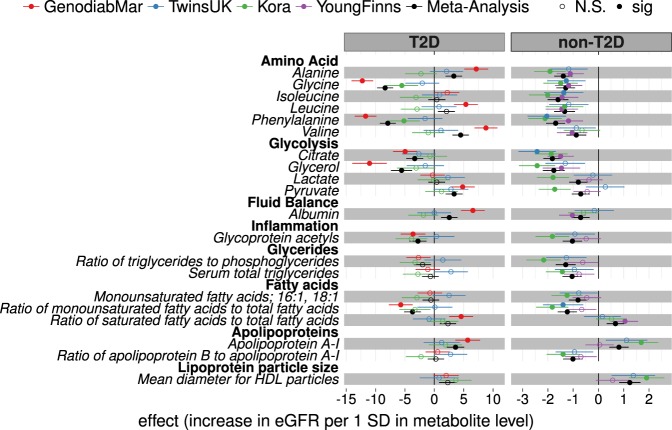
Figure 3.
Metabolic traits associated with eGFR in diabetic and non-diabetic cohorts. As for lipoprotein subclasses, associations with eGFR were calculated for several additional metabolic traits. Effect sizes per 1-SD in metabolite concentration and respective 95% confidence intervals are shown for each cohort individually and combined (black). The complete list of results including estimates for cohort heterogeneity can be found in Supplementary Table 2.

