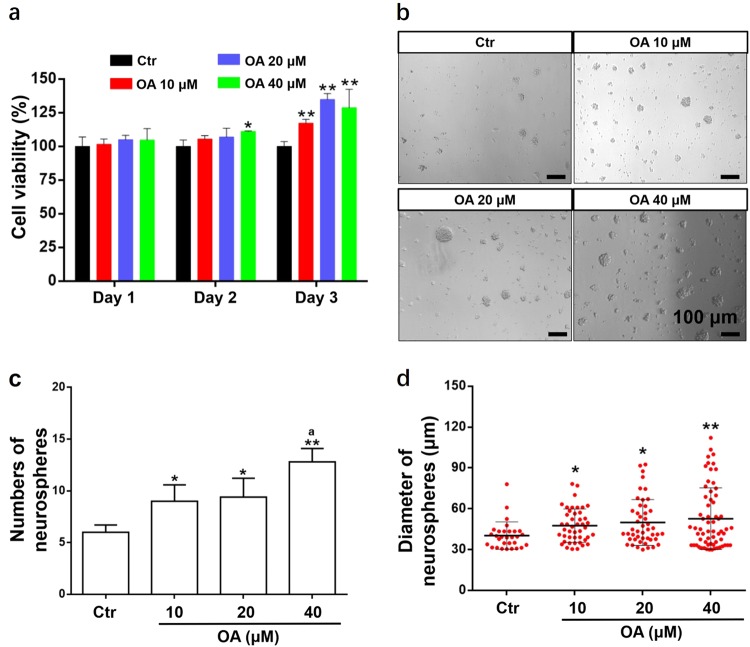
Fig. 2. OA promotes the proliferation of NSCs.
NSCs were treated with different concentrations of OA (10, 20, and 40 μM). OA-mediated NSC proliferation was analyzed by CCK-8 assay after OA treatment for 1, 2, or 3 days (a) and neurosphere assay was performed after OA treatment for 3 days (b–d). a CCK-8 assay showed cell viability was significantly enhanced in a dose- and time-dependent manner. Data are presented as means ± SD, n = 5. b An image of neurospheres after treatment with OA. Scale bars: 100 μm. The number (c) and the diameter (d) of neurospheres (diameter > 30 μm) increased with OA treatment in a dose-dependent manner. Data are presented as mean ± SD, n = 5. *p < 0.05 and **p < 0.01, compared with the Ctr group; ap < 0.05, compared with 10 μM OA group

