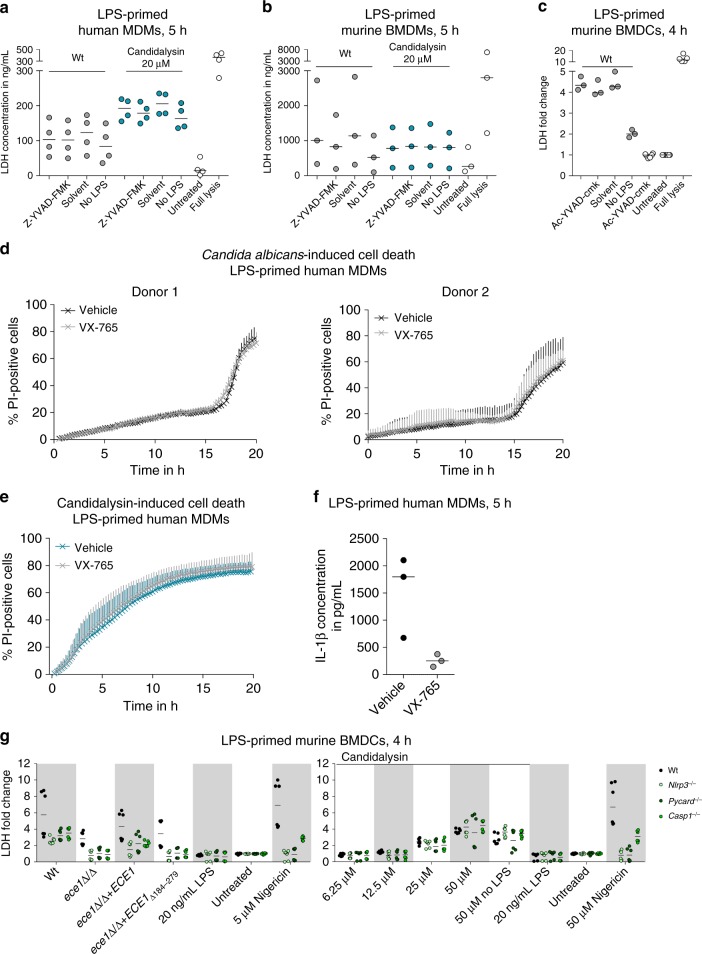
Fig. 10.
Candidalysin-induced damage is mainly caspase-1-independent. a–c Cell damage was quantified by measuring LDH release in LPS-primed or unprimed (no LPS) a hMDMs, b mBMDMs, or c mBMDCs that were infected with C. albicans Wt (MOI 6 or 5) for 5 or 4 h respectively or synthetic Candidalysin. The caspase-1-inhibitor Z-YVAD-FMK (88.9 µM, a, b), Ac-YVAD-cmk (20 µM, c) or the inhibitor solute control DMSO was added 1 h prior to infection. d, e Macrophage damage over time was assessed by quantifying PI-positive cells in LPS-primed hMDMs that were infected with d C. albicans Wt or e incubated with synthetic Candidalysin in the presence or absence of the caspase-1 inhibitor VX-765. f Nigericin (5 μm)-induced IL-1β release in LPS-primed hMDMs the presence or absence of the caspase-1 inhibitor VX-765. g Cell damage was quantified by measuring LDH release in LPS-primed or unprimed (no LPS) Wt, Nlrp3−/−, Pycard−/− or Casp1−/− mBMDCs that were infected with C. albicans Wt, re-integrant (ece1Δ/Δ + ECE1) or mutant strains (ece1Δ/Δ, ece1Δ/Δ + ECE1Δ184–279) (MOI 5) or incubated with synthetic Candidalysin for 4 h. a–c, g Values are represented as scatterplot with median of three independent experiments or donors (n ≥ 3). d The results of two different donors are displayed separately due to strong donor variability. Data are shown as mean + SD of four independent positions in at least 2 wells. e Data are shown as mean + SD of six independent donors

