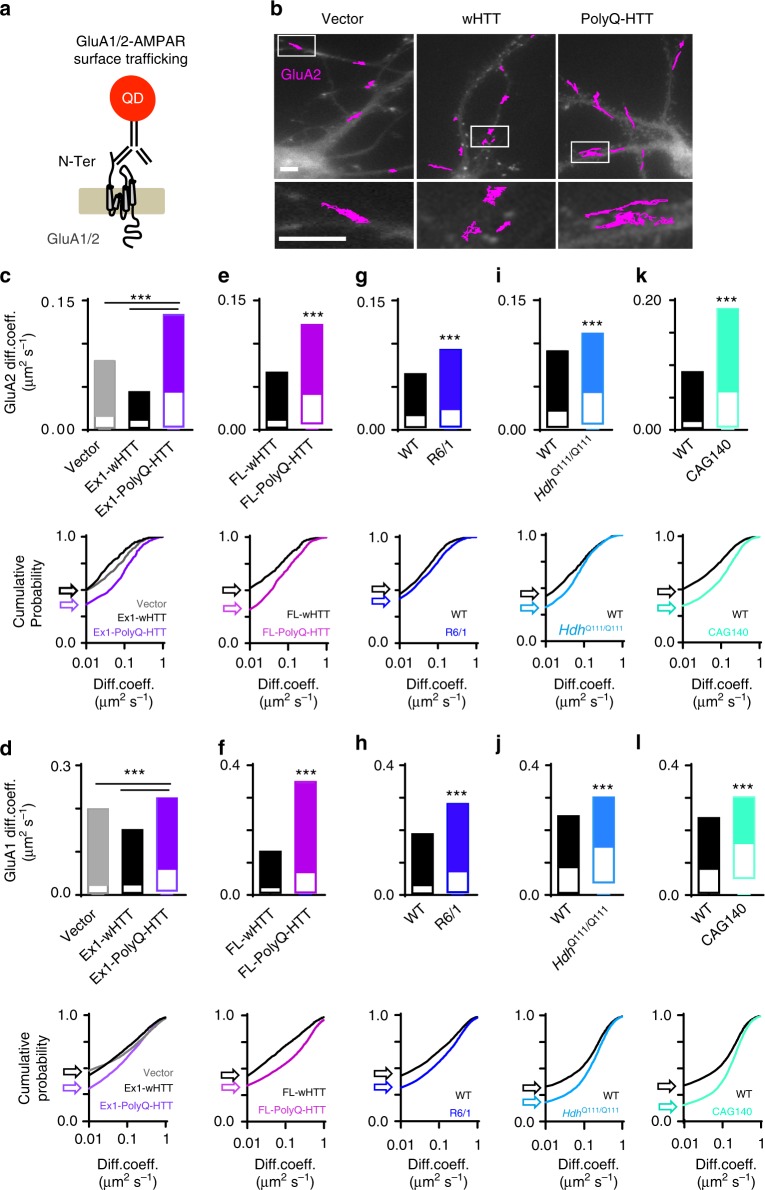
Fig. 1.
Deregulated GluA2-and GluA1-AMPAR surface diffusion in five complementary HD cellular models. a Experimental scheme for endogenous GluA2- and GluA1-AMPAR surface tracking using quantum dot (QD). b Typical GluA2-QD trajectories (magenta) in hippocampal neurons expressing vector, exon1-wHTT, and exon1-polyQ-HTT, respectively. Lower panels represent enlarged GluA2-QD trajectories. Scale bars, 10 μm. c, e, g, i, k Top panels, GluA2-AMPAR diffusion coefficients (median ± 25–75% interquartile range (IQR)) in rat hippocampal neurons expressing vector, exon1-wHTT, and exon1-polyQ-HTT; n = 844, 382, and 695 trajectories, respectively (c), in rat hippocampal neurons expressing FL-wHTT or FL-polyQ-HTT; n = 603 and 760 trajectories, respectively (e), in hippocampal neurons from R6/1 mice and WT littermate controls; n = 1885 and 1994 trajectories, respectively (g), in hippocampal neurons from HdhQ111/Q111 mice and WT littermate controls; n = 1571 and 886 trajectories, respectively (i), and in hippocampal neurons from CAG140 mice and WT littermate controls; n = 2939 and 5457 trajectories, respectively (k). d, f, h, j, l Top panels, GluA1-AMPAR diffusion coefficients (median ± 25–75% IQR) in rat hippocampal neurons expressing vector, exon1-wHTT, and exon1-polyQ-HTT; n = 9337, 8320, and 10905 trajectories, respectively (d), in rat hippocampal neurons expressing FL-wHTT or FL-polyQ-HTT; n = 4331 and 6462 trajectories, respectively (f), in hippocampal neurons from R6/1 mice and WT littermate controls; n = 18565 and 14195 trajectories, respectively (h), in hippocampal neurons from HdhQ111/Q111 mice and WT littermate controls; n = 5612 and 5844 trajectories, respectively (j), and in hippocampal neurons from CAG140 mice and WT littermate controls; n = 8569 and 9170 trajectories, respectively (l). Bottom panels, cumulative probability of GluA2 and GluA1 diffusion coefficient of respective top panel. The first point of the probability corresponding to the fraction of immobile receptors with diffusion coefficients ≤0.01 μm2 s−1 shown by arrows. Note that the cumulative curve shifts toward right indicating an increased GluA2 and GluA1 surface diffusion. Data were from 6 to 12 cells from three separate experiments. Significance was determined by Kruskal–Wallis test followed by Dunn’s multiple comparison test (c, d) or two-tailed Mann–Whitney test (e–l); ***P < 0.001

