Fig. 7.
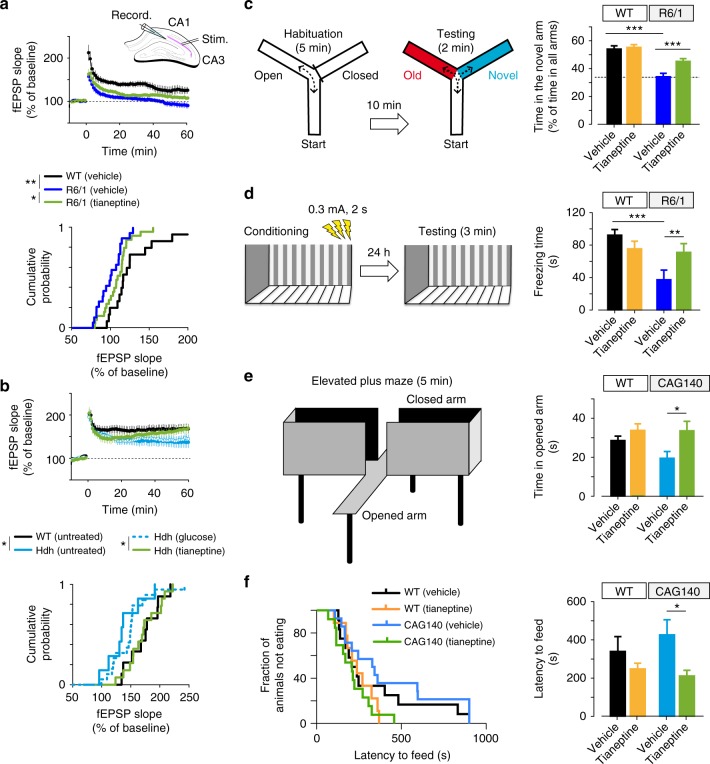
Tianeptine restores hippocampal LTP and memory and ameliorates anxiety/depression like behavior in complementary HD mouse models. a, b Field EPSPs (fEPSPs) were recorded in CA1 region containing acute slices of differently treated R6/1 (a) and HdhQ111/Q111 mice (b) following theta-burst stimulation of the Schaffer collaterals. The percentages of potentiation during last 10 min of each recordings were plotted in cumulative probability curves (bottom panels); n = 16, 22, and 26 slices for vehicle-treated WT and R6/1 mice and tianeptine-treated R6/1 mice; n = 10, 8, 20, 15 slices for untreated WT, HdhQ111/Q111 mice, and glucose- and tianeptine-treated HdhQ111/Q111 mice. c, d Hippocampus-dependent memory was examined using Y-maze (c) and contextual fear conditioning paradigm (d) in vehicle- or tianeptine-treated R6/1 and WT littermate mice. c Left, schematic diagram for Y-maze; right, percentage of time spent by mice in novel arms to that in total arms during 2-min testing time. d Left, schematic diagram for contextual fear conditioning; right, freezing time during 3-min testing time; n = 25, 28, 33, and 32 mice (c) and n = 10, 10, 10, and 12 mice (d) for vehicle- and tianeptine-treated WT and R6/1 mice. e, f Anxiety/depression-like behaviors were evaluated with elevated plus maze (EPM) (e) and novelty-suppressed feeding (NSF) paradigm (f) in HD CAG140 knock-in mice and WT littermates. e Left, schematic diagram for EPM; right, time spent in open arms in EPM, which is an anxiety index. f Values plotted were cumulative survival of animals that did not eat over 15 min (left) or mean of latency to feed in seconds (right). The latency to begin eating is an index of anxiety/depression-like behavior; n = 12, 9, 14, and 13 mice for vehicle- and tianeptine-treated WT and CAG140 mice (e, f). Data values are mean ± s.e.m (c–f). Significance was assessed by Mann–Whitney/Wilcoxon’s test (a, b), and two-way ANOVA followed by Tukey multiple comparison test with genotype and treatment as the between-subjects factors (c–f); *P < 0.05, **P < 0.01, ***P < 0.001

