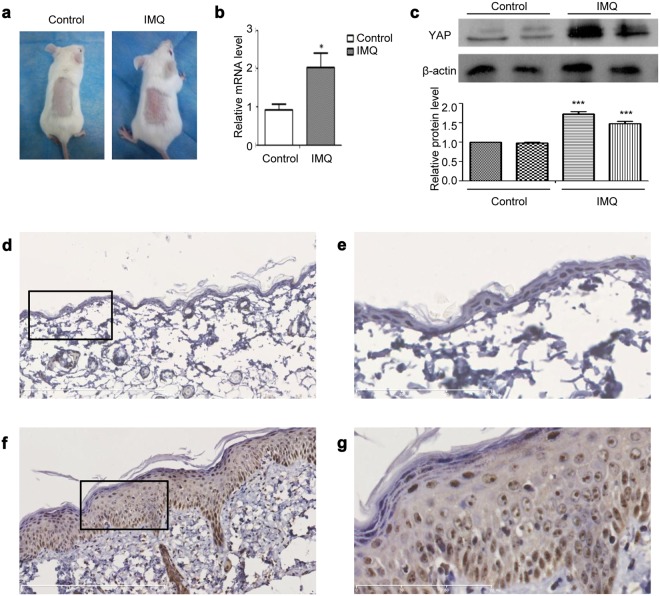
Figure 2.
YAP expression in the IMQ mouse models. (a) Gross morphology of IMQ and control group tissues. (b) qPCR analysis of YAP mRNA expression in the IMQ and control groups. (c) Western blot analysis of YAP protein expression in the IMQ and control groups. (d) Immunohistochemical results for the control group (n = 6, bar length = 300 μm). (e) Magnification of the black box in image (d) (bar length = 90 μm). (f) Immunohistochemical results for the IMQ group. (n = 6, bar length = 300 μm). (g) Magnification of the black box in image (f) (bar length = 90 μm). *P < 0.05, ***P < 0.001.

