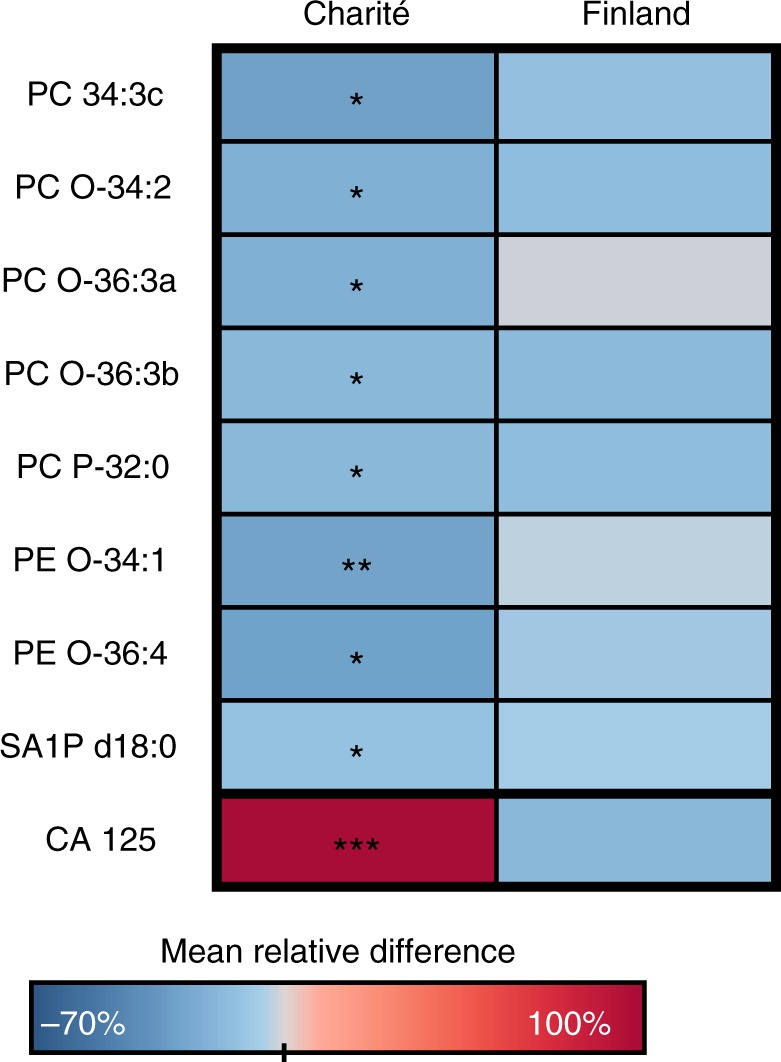
Fig. 3.

Heatmap showing lipidomic changes in patients with borderline tumours as compared to control subjects. The colour scale is adjusted according to the lipids (from −70 to 100%), CA 125 showed elevation higher than 100% in the Charité cohort. ***p < 0.001; **p < 0.01; *p < 0.05
