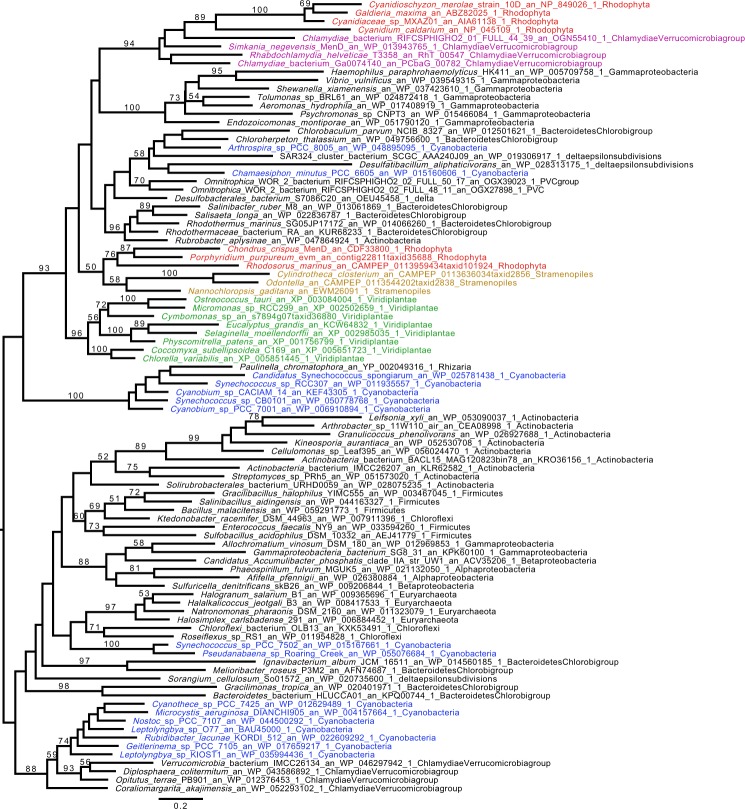
Figure 2.
Phylogenetic analysis of the plastid Cyanidiophytina MenD genes. The tree shown was obtained with IQ-TREE (Nguyen et al. 2015) obtained with the C20 model, bootstrap values are displayed onto the nodes. Bootstrap values (BV) >50% are shown. The tree is midpoint rooted. Sequences are colored according to their taxonomic affiliation: Chlamydiae (purple), Cyanobacteria (dark blue), Viridiplantae (green), Rhodophyta (red), and algae bearing a plastid obtained by secondary or tertiary plastid endosymbiosis (brown). Other organisms are in black. The scale bar shows the inferred number of amino acid substitutions per site. MenD from the Cyanidiophytina and Chlamydiae show a common origin with BV of 94.

