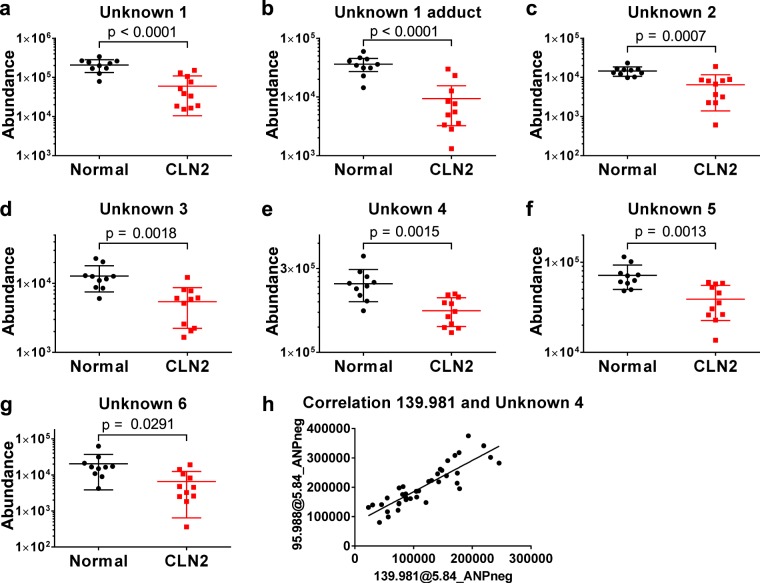
Figure 2.
Unknown metabolites 1–6 differentiate CLN2 disease subjects from normal controls. (a–g) MS signal abundances of unknown metabolites 1–6 are decreased in the CLN2 disease group versus normal controls (p < 0.05, see Table 1 for details). Indicated signal abundances were quantified as areas under their cognate chromatographic peaks. h, Linear correlation of MS signal abundances of Unknown 4 with a co-eluting metabolite feature of 139.981 Da (Pearson correlation r > 0.85, p < 0.0001), indicating a relationship as a precursor and in-source fragment ion.

