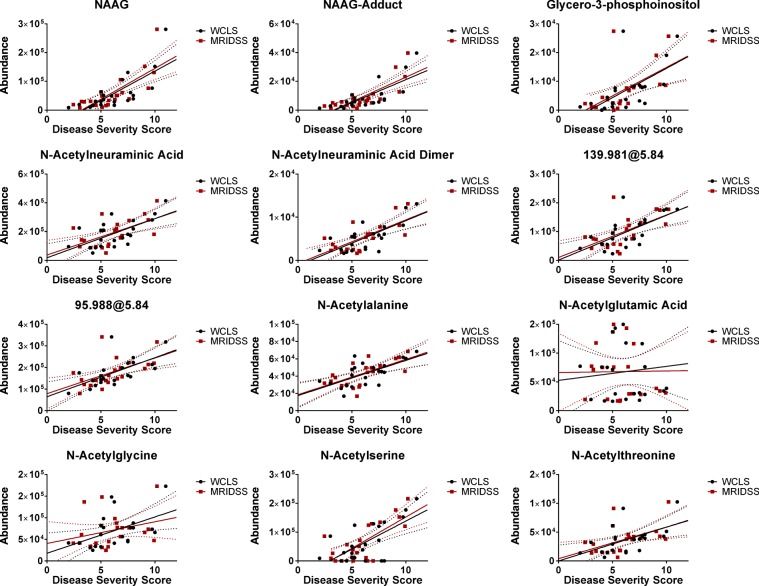
Figure 4.
Identified CLN2 disease-specific metabolite signatures linearly correlate with CLN2 disease severity scores. Final Pearson correlation analysis and linear regression analysis of CLN2 specific metabolite signatures and the magnetic resonance imaging disease severity score (MRIDSS) or the Weill Cornell LINCL score (WCLS) of all CLN2 subjects (test and validation cohort). Relative metabolite abundances (ion counts, y-axis) are plotted against the disease severity scores (x-axis). Dotted lines represent the 95% confidence bands. Pearson r and p-values are summarized in Table 2.

