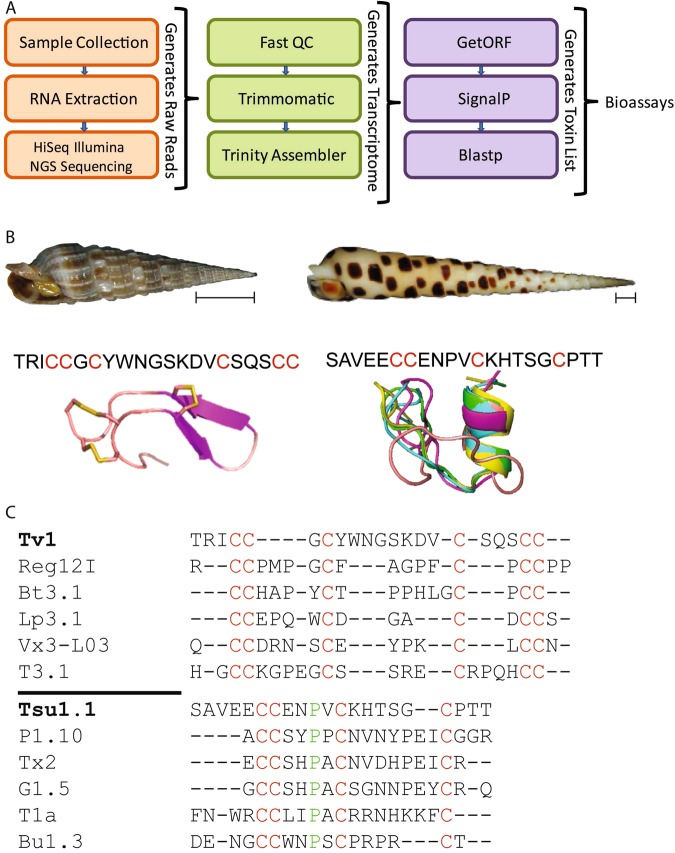
Figure 2.
Comparison of Tv1 and Tsu1.1 teretoxins. (A) The bioinformatic pipeline used to identify Tsu1.1. The orange box indicates the initial steps to generate reads through next-generation sequencing (NGS), the green shows the process to assemble the terebrid venom gland transcriptome, and the purple represents the final steps that lead to the discovery of teretoxins. (B) Shell images of Terebra variegata (left) and Terebra subulata (right), scale bar represents ~1 cm, followed by the sequence of each venom peptide, with cysteines highlighted in red, followed by the NMR structure of Tv146 and the predicted I-TASSER structure of Tsu1.1. (C) An alignment of Tv1 and conotoxins in the M-superfamily, followed by an alignment of Tsu1.1 and conotoxins in the A-superfamily. Green represents shared amino acids, while red represents shared cysteine framework.

