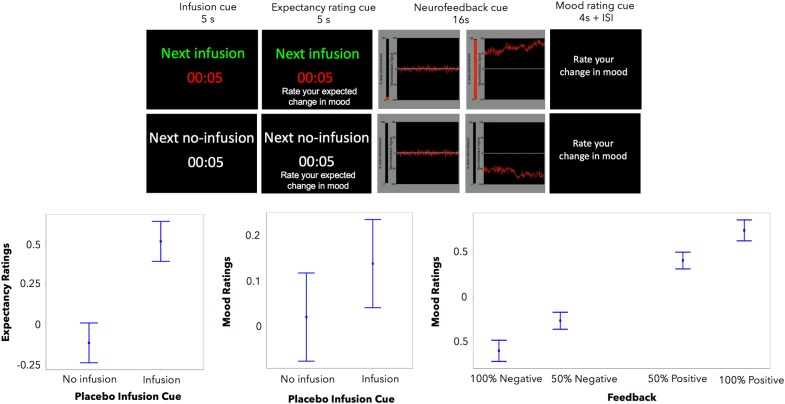
Fig. 1.
Sham neurofeedback task. Top: During each trial, participants are presented with either a “drug” infusion or no-infusion cue, followed by a positive or negative neurofeedback cue of two different magnitudes of response, low and high. Bottom: The “drug” infusions, compared to the no-infusions, were associated with significantly higher expectancy and mood ratings (left, center). Similarly, positive sham neurofeedback, compared to negative, was associated with significantly higher mood ratings (right). Y-axis indicates expectancy or mood ratings (much better = 3, better = 2, slightly better = 1, no change = 0, slightly worse = −1, worse = −2, and much worse = −3). Error bars represent 95% confidence intervals

