Fig. 1.
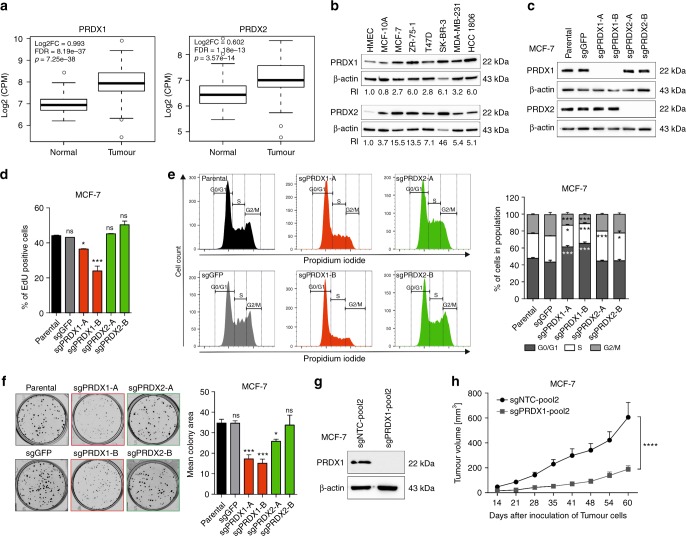
Characterisation of PRDX1 and PRDX2 knockout in MCF-7 breast cancer cell line and in in vivo xenotransplantation model. a Analysis of the expression of PRDX1 (left panel) and PRDX2 (right panel) mRNA in normal and breast cancer tissues available in the analysed TCGA dataset (n = 108 pairs), regardless of the ethnicity of the patient. b Representative western blotting results showing the protein presence of PRDX1 and PRDX2 in HMEC, MCF-10A, MCF-7, ZR-75-1, T47D, SK-BR-3, MDA-MB-231, and HCC1806 cell lines. β-actin was used as a loading control. Bands were quantified by densitometry, RI was calculated as the quotient of the densitometry signal for PRDX1 (or PRDX2) band and that for β-actin and then normalised to that of the HMEC. Averaged RI value from two independent experiments was shown. c Western blotting shows efficient depletion of PRDX1 or PRDX2 proteins in the MCF-7 single-cell-derived clonal lines compared to parental and sgGFP controls. β-actin was used as a loading control. d Detection of DNA synthesis using EdU incorporation assay in PRDX1-knockout MCF-7 cells (red bars) compared to controls (black and grey bars) and PRDX2-knockout cells (green bars). *p < 0.05, ***p < 0.001. e Cell cycle analysis evaluated by the propidium iodide flow cytometry-based assay. Representative cell cycle profiles showing the distribution of cells in the different phases of the cell cycle for PRDX1-knockout MCF-7 cells compared to controls and PRDX2-knockout cells are presented (left panel). Summary of the percentage of cells in each phase of the cycle (right panel). Data shown are cumulative results from two independent experiments performed in triplicates, *p < 0.05, ***p < 0.001. f Representative images for the colony formation in MCF-7 cells (left panel) and a quantitative analysis of colony formation assay in PRDX1-knockout MCF-7 cells. Data shown are cumulative results from three independent experiments. *p < 0.05, ***p < 0.001. g Western blotting shows efficient depletion of PRDX1 protein in MCF-7-sgPRDX1-pool2 cells as compared to sgNTC-pool2 control. β-actin was used as a loading control. h Plots of mean tumour volumes in mice (initial n = 10 per group) inoculated with control (sgNTC-pool2) and sgPRDX1-pool2 of MCF-7 cells. Points are means and bars are SD. Statistical analysis was performed with two-way Anova test (****p < 0.0001)

