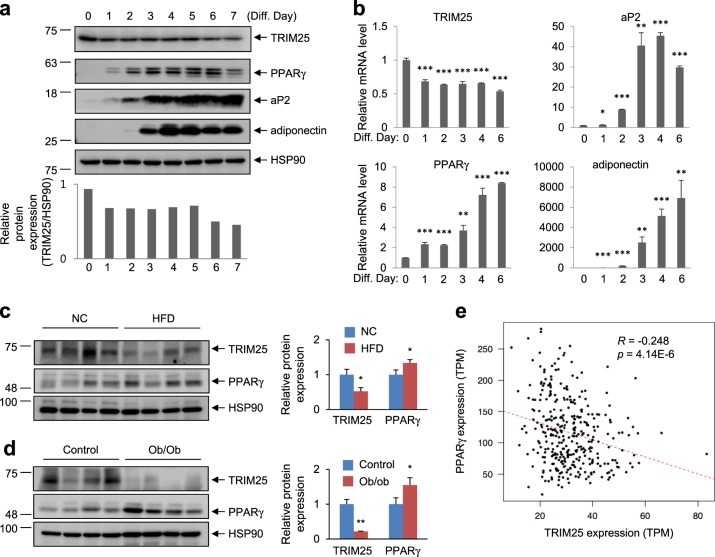
Fig. 5. Negative correlation between TRIM25 and PPARγ expression both in mice and humans.
a Immunoblot analysis of TRIM25, PPARγ, and adipogenic markers during 3T3-L1 cell differentiation. Relative TRIM25 protein levels were measured using ImageJ (bottom graphs). b Real-time quantitative PCR analysis of the mRNA expression of TRIM25, PPARγ, and adipogenic markers during 3T3-L1 cell differentiation. c Immunoblot analysis of TRIM25 and PPARγ in white adipose tissue (WAT) of normal chow-fed (NC) vs. high-fat-fed (HFD) mice. d Immunoblot analysis of TRIM25 and PPARγ in WAT of control vs. ob/ob mice. Relative TRIM25 and PPARγ protein levels were measured using ImageJ (right graphs). e Pearson correlation coefficients between TRIM25 and PPARγ levels within human subcutaneous fat samples were calculated. All error bars shown are the s.e.m. (*p < 0.05, **p < 0.01, ***p < 0.001)

