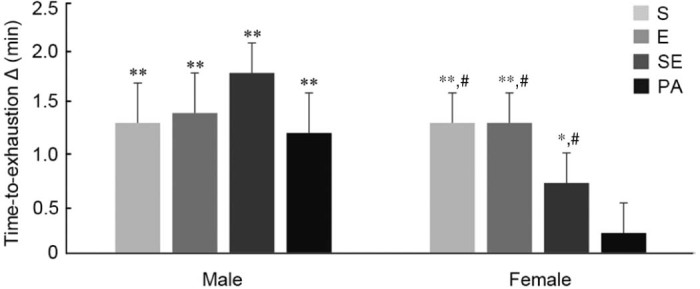
Fig. 2.

Time-to-exhaustion delta in minutes. Error bars represent one standard error of the mean. *p < 0.05, **p < 0.001, baseline–post differences; #p < 0.05, compared with PA group in female. E = endurance training group; PA = physical activity recommendation group; S = strength training group; SE = combined strength + endurance training group.
