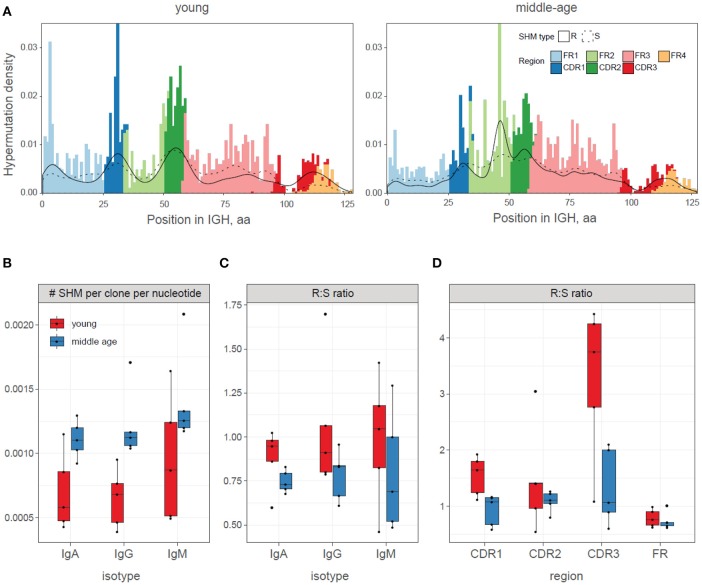
Figure 5.
Patterns of newly acquired somatic hypermutations in young and middle-age donors vaccinated with YF. (A) Summary profile of somatic hypermutations observed in the study. IGH regions are marked with color. The distribution of silent (S) and replacement (R) hypermutations are shown with dashed and solid lines, respectively. For CDR3 region, mutation analysis was done using the root as reference. Data were pooled for all young and all middle-age individuals. (B) Frequency of newly acquired somatic hypermutations (SHMs) in young (red) and middle-age (blue) donors. ANOVA p = 0.0005 for age, 0.14 for isotype. (C,D) Mean replacement:silent ratio (R:S ratio) for newly acquired somatic hypermutations (SHMs) in young and middle-age donors, for isotypes (C, ANOVA p = 0.058 for age, 0.69 for isotype) and regions (D, ANOVA p = 0.0013 for age, 0.00014 for regions).

