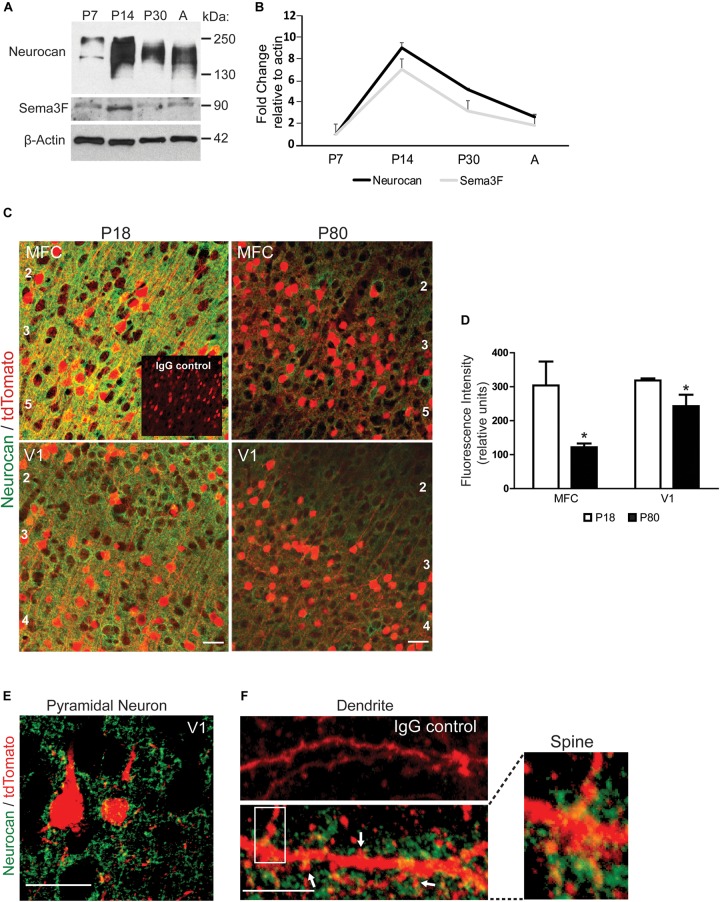
FIGURE 1.
Expression of Neurocan in developing mouse neocortex. (A) Representative immunoblots of Neurocan and Sema3F in lysates of cerebral cortex (50 μg) from postnatal (P7, P14, and P30) and adult brain (A). β-Actin served as loading control. (B) Relative levels of Neurocan and Sema3F in cerebral cortex at each developmental stage (n = 3) normalized to β-actin. Mean ± SEM are shown. (C) Immunofluorescence staining for Neurocan (green) and tdTomato (red) in coronal sections from MFC and V1, in Nex1-CreERT2:Ai9 mice at adolescent (P18) and adult (P80) stages. Nonimmune IgG control is shown as an inset. Cortical layers are numbered. Scale bar = 50 μm. (D) Fluorescence intensity of Neurocan immunostaining in MFC and V1 at P18 and P80 (n = 10 images for each condition from three brains). Mean differences (±SEM) in Fc versus Sema3F-Fc treated cultures were compared for significance (∗t-test and p < 0.05). (E) Representative image showing Neurocan immunostaining (green) surrounding tdTomato-positive pyramidal neurons in V1, of Nex1-CreERT2:Ai9 mice. Scale bar = 50 μm. (F) Upper panel, normal IgG; lower panel, Neurocan immunostaining (green) around dendrites with spines (scale bar = 10 μm). Far right panel shows magnified view of boxed area.

