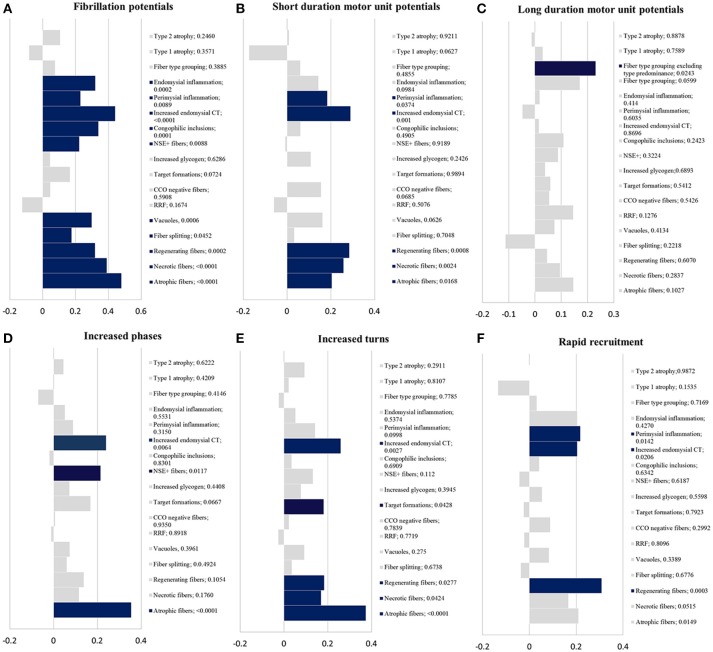
Figure 2.
Statistical results. Kendall-tau t-value (x-axis) vs. histopathologic findings with correspondent p-value (y-axis); blue bars have a p < 0.05 and gray bars ≥ 0.05. (A) fibrillation potentials; (B) short duration motor unit potentials; (C) long duration motor unit potentials; (D) increased phases; (E) increased turns; (F) rapid recruitment. CCO, cytochrome c oxidase; CT, connective tissue; NSE+ fibers, fibers reacting for non-specific esterase; RRF, ragged-red fibers.

