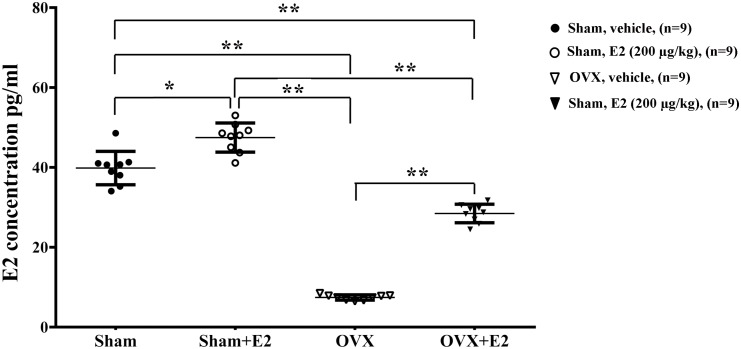
FIGURE 6.
Serum levels of E2 in female rat. Serum was collected 24 h after subcutaneous injection of E2 (0.2 μg/g) or vehicle (saline) in OVX or sham mice, and measurement of E2 in the serum was conducted by ELISA. ∗p < 0.05, ∗∗p < 0.01 versus sham. One-way ANOVA, n = 5 rats per group. All the data are mean ± SEM.

