
FIGURE 2.
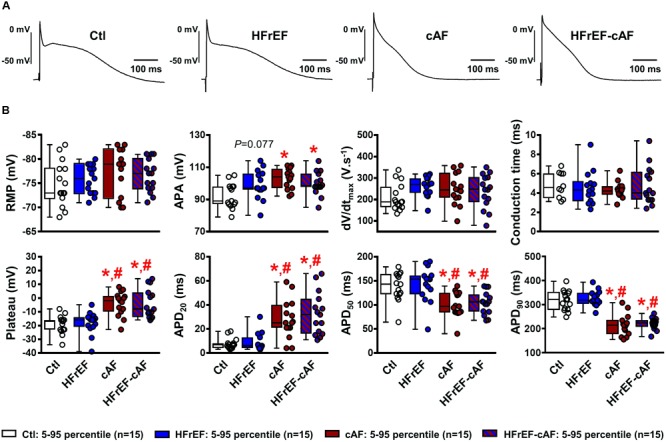
Electrical remodeling in multicellular human atrial trabeculae. (A) Representative action potential (AP) recordings in multicellular preparations from Ctl, HFrEF, cAF or HFrEF-cAF patients (from left to right). (B) Quantification of AP parameters in Ctl (white bars), HFrEF (blue bars), cAF (red bars) or HFrEF-cAF (red/blue-striped bars) patients. Top row shows (from left to right): resting membrane potential (RMP), AP amplitude (APA), maximal AP upstroke velocity (dV/dtmax) and conduction time (note different n-numbers). Bottom row shows (from left to right): level of AP plateau and AP duration (APD) at 20%, 50%, and 90% of repolarization. ∗ indicates P < 0.05 vs. Ctl, # indicates P < 0.05 vs. HFrEF. Numbers indicate number of patients.