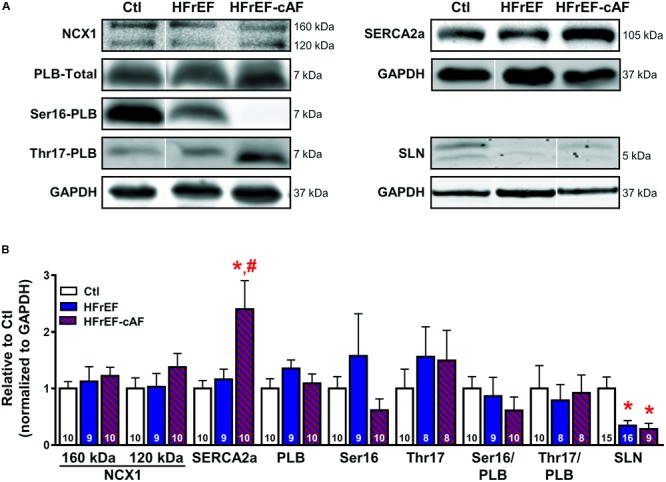
FIGURE 6.

Molecular determinants of increased sarcoplasmic reticulum (SR) Ca2+ load. (A) Representative Western blot examples of protein expression of Na+-Ca2+-exchanger type-1 (NCX1; full-length protein of 160 kDa with proteolytic fragment at 120 kDa), SR Ca2+-ATPase type-2a (SERCA2a) and its inhibitory regulators phospholamban (PLB; total PLB as well as Ser16- and Thr17-phosphorylated PLB) and sarcolipin (SLN). GAPDH was used as loading control. Ser16-PLB of HFrEF-cAF represents an extreme example. (B) Quantification of NCX1, SERCA2a, total PLB, Ser16- and Thr17-phosphorylated PLB, Ser16/total PLB, Thr17/total PLB, and SLN in right-atrial tissue homogenates of Ctl (white bars), HFrEF (blue bars) or HFrEF-cAF (red/blue-striped bars). Numbers in bars indicate number of patients. ∗ indicates P < 0.05 vs. Ctl, # indicates P < 0.05 vs. HFrEF.
