

Abstract
Background
Mild equine asthma is presumed to arise in response to environmental exposures but the relative impact of differing inflammatory phenotypes upon performance are largely unexplored.
Hypotheses: Airway inflammation negatively affects performance and cytological phenotype varies with environmental exposure.
Animals
Thoroughbred racehorses in active training and racing.
Methods
Thoroughbreds were recruited 24‐48 hours before racing. Each horse was eligible for re‐enrollment with each race entry. Within one hour of race completion, physical examination, respiratory endoscopy, and BAL were performed. Respirable and inhalable dust, respirable endotoxin, and respirable β‐glucan exposures were measured at the breathing zone within one week after racing. Controlling for age, trainer, and pulmonary hemorrhage, the relationship between performance, bronchoalveolar lavage fluid (BALF) cytology, and measures of exposure were modeled.
Results
Performance and BALF data were collected on 64 individual horses from 8 stables for a total of 98 race performances and 79 dust exposure assessments. Evidence of mild equine asthma was found in 80% (78/98) of BALF samples from 52/64 horses. For each percent increase in BALF mast cell and neutrophil proportions, speed figures were reduced by 2.9 (P = .012) and 1.4 (P = .046) points, respectively. Respirable dust concentration was associated with BALF neutrophil proportions (P = .015). Bronchoalveolar lavage fluid mast cell proportions were only associated with respirable β‐glucan exposures (P = .030).
Conclusions and Clinical Importance: Mild equine asthma is common in racing horses and negatively impacts performance. The data support that respirable, rather than inhalable, dust exposure measures are pertinent to equine airway health.
Keywords: beta‐glucan, bronchoalveolar lavage, dust, endotoxin, horse, parenchymal disease, pulmonary contusion/hemorrhage, respiratory tract
Abbreviations
- BAL
bronchoalveolar lavage
- BALF
bronchoalveolar lavage fluid
- EIPH
exercise induced pulmonary hemorrhage
- TB
thoroughbred
1. INTRODUCTION
Mild to moderate equine asthma, also known as inflammatory airway disease, is commonly observed in poorly performing horses. Because affected horses appear clinically normal at rest except for occasional coughing, diagnosis requires advanced techniques such as endoscopic detection of increased tracheal mucus accumulation or demonstration of increased proportions of inflammatory cells recovered in bronchoalveolar lavage fluid (BALF).1 While excess tracheal mucus accumulations have been associated with poor race performance,2 the relationship between performance and BALF cytology remains unclear.
In mature horses with asthma, increased proportions of BALF neutrophils are the most common cytologic finding. However, in young horses, numbers of mast cells and eosinophils in BALF are often increased, suggesting hypersensitivity.1, 3, 4, 5, 6, 7 Different cytologic manifestations of equine asthma might reflect differing disease mechanisms with different implications for performance. While neutrophilic equine asthma has been associated with cough in the absence of derangement in lung function,5 eosinophilic, and mastocytic airway inflammation are typically accompanied by airway hyper‐responsiveness.5, 6 Published reports investigating BALF cytology in athletic horses are often limited to horses presented for poor performance.8, 9, 10 To our knowledge, no prospective study classifying asthma phenotype by BALF cytology has been performed in racehorses using a nonbiased approach; therefore, the relative impact of neutrophilic versus eosinophilic/mastocytic airway inflammation on performance is unknown.
The heterogeneity of cytologic phenotype also suggests the possibility of heterogeneous etiologies. Exposure to airborne dust and other irritants appears to play an important role in triggering the disease. Upon barn confinement, horses are exposed to higher concentrations of dust11 and endotoxin,11, 12 and introduction of otherwise healthy horses to stall confinement is sufficient to induce airway inflammation.13, 14, 15, 16 Increased tracheal mucus accumulations are associated with higher particulate concentrations.17 Despite convincing circumstantial evidence, research directly relating BALF cytology to exposure is sparse. In young TB horses entering race‐training, respirable dust exposures are correlated with eosinophilic inflammation,7 but the applicability of this data to a more general population is unknown. Accurate assessment of the relationship between airway inflammation and environmental exposures requires measurement in the horse's breathing zone to capture individual variations in exposure.18
Though asthma can affect horses of any discipline, the racehorse provides an ideal study subject, as the disease is well recognized, the prevalence is high, and objective measures of performance are readily available in this population. Equibase, the official database for TB racing in the US, offers a numeric rating of performance, the “Equibase speed figure” (Equibase, Lexington, Kentucky), that is, a function of racing time adjusted for variations between races such as distance, track conditions, and run‐up distance, providing an objective measure of individual horse performance across races of different lengths and conditions.19
Therefore, our study was designed to explore the impact of airway inflammation as determined by BALF cytology upon race outcomes in TB horses racing in Indiana and to investigate the association between environmental exposures to dust and BALF cytology.
2. MATERIALS AND METHODS
2.1. Study design
A prospective observational study of TB horses racing in Indiana was performed during three racing meets between September 2014 and October 2016. The study was publicized via meetings with trainers and owners, posting of brochures at the track and advertisements in local press. Upon publication of each weekday's racing program, trainers who had previously expressed an interest in study participation were contacted and permission for the enrollment of each horse was sought 24–48 hours before racing. On the day of racing, an informed consent form was signed before the race. Enrolled horses underwent physical examination, endoscopy of the respiratory tract, and BAL ∼1 hour after the horse completed the race. Four to 7 days after the race, breathing zone concentrations of respirable and inhalable particulates were measured over the course of 4–6 hours on a single occasion. Horses were eligible for re‐enrollment with every race entered. The Purdue University Animal Care and Use Committee and the Indiana Horse Racing Commission approved all procedures.
2.1.1. Clinical score
Signs of respiratory disease, including cough, nasal discharge, respiratory effort, and auscultation, were scored from 1, representing normal breathing, to 21, representing severe respiratory signs such as dyspnea (Supporting Information Table S1).20
2.1.2. Endoscopic examination
Horses were restrained with a nasal twitch and a flexible fiber‐optic endoscope (7.9 mm outer‐diameter, 110 cm long) was passed through the ventral meatus to the level of the pharynx. The degree of pharyngeal lymphoid hyperplasia was scored from 0 (no follicles) to 4 (numerous, large, edematous follicles).21 Any upper respiratory tract abnormality was recorded, and arytenoid cartilage abduction was graded from 1 (synchronous with full abduction) to 4 (paralysis).22 The endoscope was advanced past the larynx into the trachea until the bifurcation was visible. Scores were assigned to tracheal mucus accumulation from 0 (no mucus) to 4 (large, pool‐forming),23 and exercise induced pulmonary hemorrhage (EIPH) from 0 (no blood) to 4 (streams covering more than 90% of tracheal surface).24 To facilitate BAL, the carina and larynx were sprayed with a 0.4% lidocaine solution as the endoscope was removed (20–30 mL at each site).
2.1.3. BAL
Horses were sedated with xylazine hydrochloride (0.2–0.5 mg/kg IV; AnaSed, Akorn Animal Health, Lake Forest, IL) and butorphanol tartrate (0.02 mg/kg IV; Torbugesic, Zoetis, Parsippany‐Troy Hills, New Jersey). A sterile BAL tube (300 cm long; 10 mm outer diameter; Bivona, Gary, Indiana) with inflatable cuff was passed through the nose and wedged into a peripheral bronchus. Two hundred fifty milliliter of sterile 0.9% NaCl were infused and recovered manually with 60‐mL sterile syringes. Cytological specimens were prepared by centrifugation and processed with modified Wright stain. Differential cell counts were performed on 400–600 cells.
2.1.4. Case definition
Equine asthma was diagnosed on the basis of normal breathing effort at rest and BALF differential cytology counts. Horses with >5% neutrophils, >2% mast cells, >1% eosinophils or any combination thereof were classified as mild asthmatics.1
2.1.5. Particulate measurements
Gravimetric filter sampling was conducted as previously described.7 Briefly, particulate samples were collected with personal sampling pumps (AirCheck 2000, SKC, Inc., Eighty Four, PA). The respirable fraction (50% cutoff of 4 μm) was collected using an aluminum cyclone (SKC, Inc, Eighty Four, PA). The inhalable fraction (50% cutoff of 100 μm) was collected using an IOM personal sampler (SKC, Inc, Eighty Four, PA). Pumps were calibrated before and after sampling (Defender Bios, SKC, Inc, Eighty Four, PA). Respirable samples were collected on 37 mm type AE glass fiber filters, while inhalable samples were collected on 25 mm PVC filters (SKC, Inc, Eighty Four, PA). The cyclone and IOM sampler were secured to the noseband of the halter to sample dust at the breathing zone of the horse. The pumps were secured to a surcingle placed around the girth of the horse and connected to the samplers with flexible tubing (Tygon, Saint Gobain, France) secured to the mane and forelock of the horse. The horse was free to move around the stall as usual. Dust measurements were determined gravimetrically by subtracting the average of three weights taken before sampling from the average of three weights obtained after sampling. Filters were placed in a desiccator for 24 hours before weight measurements. Glass fiber filters were stored at −20°C until elution for endotoxin and β‐glucan analysis.
2.1.6. Respirable endotoxin and β‐glucan analysis
Endotoxin and β‐glucan content of respirable dust was measured using a kinetic chromogenic limulus amebocyte lysate technique (NexGen PTS, Charles River Laboratories, Wilmington, Mississippi). Extraction was conducted in a sterilized laboratory hood using 5 mL nonpyrogenic sterile water for elution and end‐over‐end agitation for 30 minutes at room temperature. Samples were analyzed immediately after extraction according to the manufacturer's instructions.
2.1.7. Statistical analysis
A priori sample size calculations were performed using commercial software (SAS version 9.3, SAS Institute Inc, Cary, North Carolina). We estimated that if BALF cytological variation accounted for 20% of the variation in performance, a sample size of 98 horses would provide 80% power to detect this relationship at an α = 0.05. We set enrollment target of 106 horses to allow for 8% nondiagnostic BALF cytological preparations. Race data was extracted from the official on‐line database for Thoroughbred racing (Equibase, Lexington, Kentucky KY), including horse birthdate, Equibase speed figure, and race place. The Equibase speed figure is an integer that is assigned to each performance based upon speed and adjusted for trace and track variants. A speed figure of 100 is assigned to an 8 furlong (1 mile) race run in 1 minute 36 seconds; this speed figure is adjusted up for faster times (80 points per second per furlong) and down for slower times. The relationships between speed figure and cytology variables (BALF neutrophil, mast cell, and eosinophil proportions and absolute numbers) were modeled using generalized estimating equations controlling for trainer, horse age, and EIPH score.2 Mixed logistic regression models were constructed to examine the effect of cytology variables upon the likelihood of winning. A reference population of horses finishing in the top three positions with mucus scores ≤2 was identified and 95% confidence intervals of the mean proportions of BAL neutrophils and mast cells were constructed. Mixed logistic regression models were constructed using dichotomous classification variables for inflammation. Models were constructed to evaluate the effect of neutrophilic inflammation when defined as proportions greater than 5%, 10%, or the upper limit of 95% confidence interval calculated for the reference population and the effect of mastocytic inflammation when defined by cut‐offs of 2%, 5%, or using the upper limit of the reference range derived from normal, well‐performing horses in the study. The relative effects of exposure measurements (respirable dust, inhalable dust, respirable endotoxin, and respirable β‐glucan) upon cytology variables were examined using generalized linear mixed models that included horse as a random effect and controlled for trainer and horse age.7 Assigned link functions and data distributions were evaluated by visual inspection of diagnostic residual plots. Multiplicative over dispersion residual terms were included in those models in which the generalized chi‐square to degrees of freedom ratio indicated over‐dispersion. Correlations between exposure measures were quantified using Spearman rank correlations. Significance was set at P < .05. Tukey's post‐hoc analysis was used to control for multiple pair‐wise comparisons. Descriptive statistics are summarized as mean ± standard deviation. In the case of endoscopic scores, median and range are reported. All analyses were performed using commercial software (SAS version 9.4, SAS Institute Inc, Cary, North Carolina).
3. RESULTS
Eight trainers participated, with a median of 6.5 horses enrolled per trainer (range 1–52). Seventy‐six horses in 118 races were enrolled, with horses enrolled up to four times over a two‐year period (2015–2016). Samples were collected between May and October, with 70% obtained between August and October. Of the 118 enrollments, 2 horses were claimed, 7 horses failed to complete the race, BAL was unsuccessful in 2 horses, and 9 BALF cytospin preparations were nondiagnostic because of cell lysis. Thus, 98 BALF samples were available for analysis on 64 individual horses (Figure 1). The mean age of sampled horses was 4.0 ± 1.4 years. Increased inflammatory cell proportions were documented in 78 BALF samples (80%), with increased neutrophil proportions in 33 samples (34%), increased mast cell proportions in 56 samples (57%), and increased eosinophil proportions in only 4 samples. Specifically, inflammation was classified as neutrophilic in 20 samples and mastocytic in 41, while mixed inflammation was identified in 16 samples (n = 12 neutrophilic and mastocytic inflammation, n = 1 mixed neutrophilic and eosinophilic inflammation, and n = 3 mixed mastocytic and eosinophilic inflammation). Exercise induced pulmonary hemorrhage scores ranged from 0 to 4, with a median score of 1. Tracheal mucus scores ranged from 0 to 5, with a median score of 2.
Figure 1.
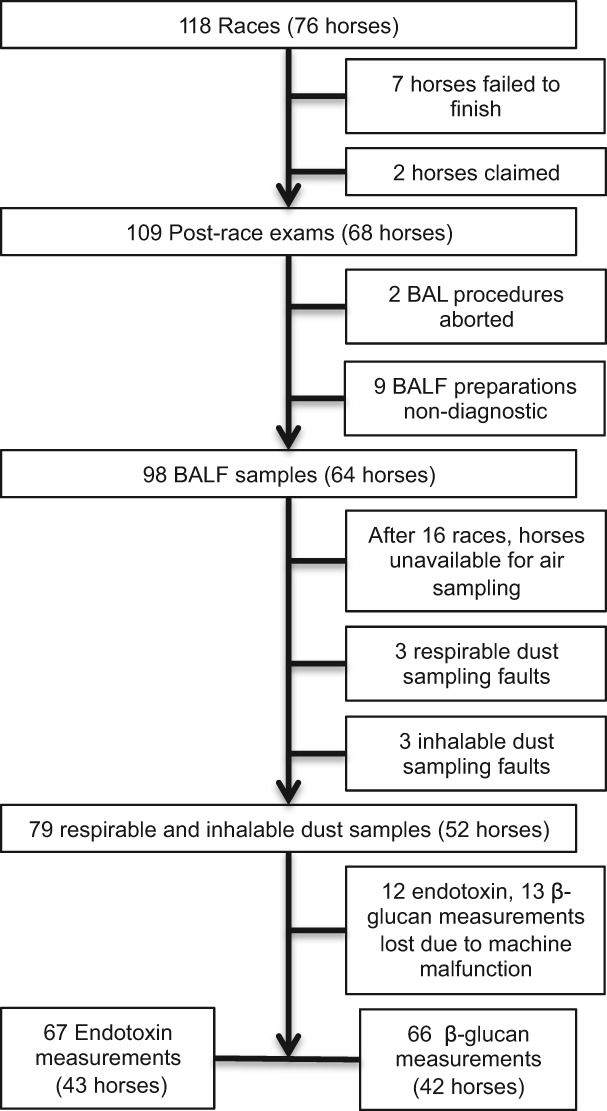
Flow diagram of sample collection. BALF = Bronchoalveolar lavage fluid
Of the horses with BALF cytology results, only 16 horses were identified as performing well based on placing 1st, 2nd, or 3rd with endoscopic tracheal mucus scores ≤ 2. The upper limit of 95% confidence intervals of the mean for neutrophils and mast cells were calculated, indicating an upper limit of 6.2% for neutrophil proportions and 2.6% for mast cell proportions. Similar to the overall study population, this population of well‐performing horses had a mean age of 4.0 ± 1.6 years.
The mean speed figure of the study population was 53.6 ± 21.3. Modeling demonstrated a statistically significant negative effect of mast cell (Figure 2) and neutrophil (Figure 3) proportions upon performance, with a similar effect seen for absolute cell numbers (Table 1). For each percent increase in BALF mast cell proportions, the speed figure dropped by nearly 3 points, while each percent increase in BALF neutrophils dropped the speed figure by 1.4 points. Age was positively associated with performance (P = .002, Figure 4).
Figure 2.
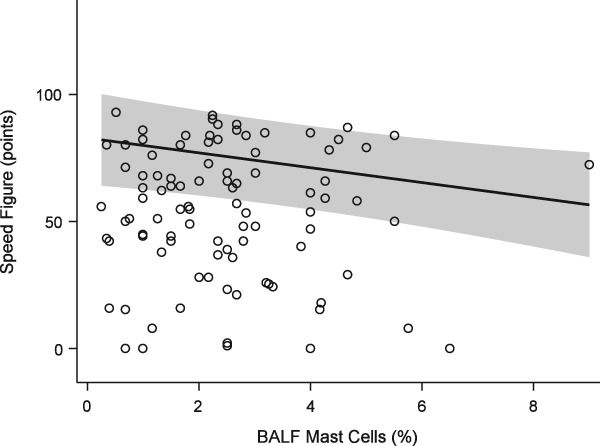
Generalized estimating equation model of performance (Equibase speed figure) versus BALF mast cell proportions. Solid line = predicted mean response fit at age = 3.96 years, EIPH score = 1, trainer = 1, neutrophil proportion = 4.49%. Shaded band = 95% confidence interval of the mean response. Open circles = observations
Figure 3.
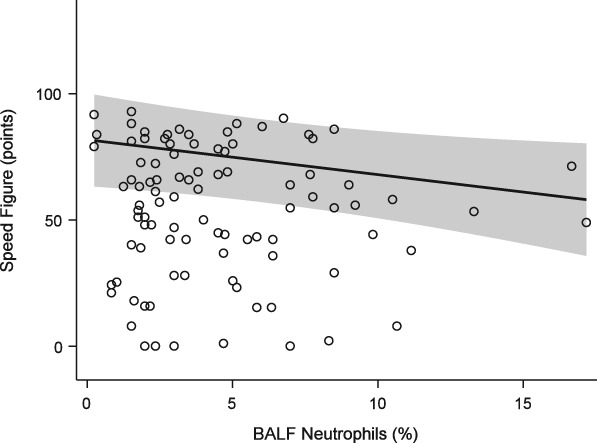
Generalized estimating equation model of performance (Equibase speed figure) versus BALF neutrophil proportions. Fit at mast cell proportion = 2.48%. See Figure 2 for full legend
Table 1.
Generalized estimating equations model of horse performance (Equibase speed figure) versus bronchoalveolar lavage cytology (n = 98), controlling for age, trainer, and EIPH score
| Variable | Estimate | P‐value |
|---|---|---|
| Mast Cell (%) | −2.92 | .012 |
| Neutrophil (%) | −1.38 | .046 |
| Eosinophil (%) | −0.77 | .68 |
| Mast Cell Number (cells/μL) | −1.05 | .058 |
| Neutrophil Number (cells/μL) | −0.57 | .017 |
| Eosinophil Number (cells/μL) | −0.11 | .87 |
Figure 4.
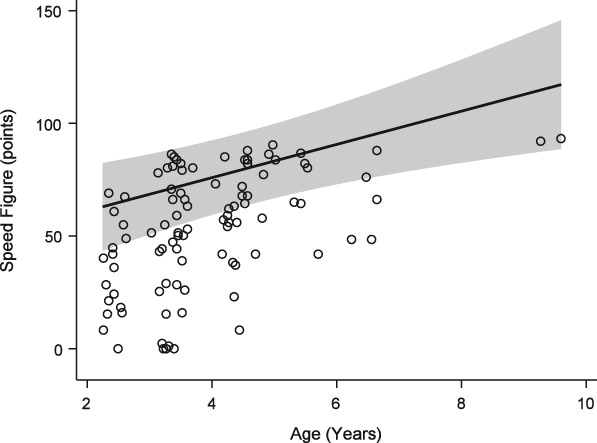
Generalized estimating equation model of performance (Equibase speed figure) versus age. See Figure 2 for full legend
In a mixed logistic regression model controlling for age and EIPH score, with trainer and horse included as random effects, increasing proportions of BALF mast cells were associated with a decreased likelihood of winning (P < .001). However, this model indicated that increasing proportions of neutrophils were not associated with decreased likelihood of winning (P = .77). When the covariates mast cell and neutrophil proportions were replaced by dichotomous class variables, only mast cells ≤ 2%, mast cells ≤ 2.6%, and neutrophils ≤ 6.2% were associated with a greater likelihood of winning (P < .001). Effect estimates are summarized in Table 2.
Table 2.
Effect estimates of logistic regression model: likelihood of winning versus bronchoalveolar lavage cytology (n = 98), controlling for age, trainer, and EIPH score
| Variable | Estimate (Factor Change per unit increase) | P‐value |
|---|---|---|
| Mast cell (%) | −0.090 (0.89) | <.001 |
| PMN (%) | 0.03 (1.03) | .77 |
| Mast cell ≤ 2% | 0.38 (1.46) | <.001 |
| Mast cell ≤ 2.6% | 0.57 (1.78) | <.001 |
| Mast cell ≤ 5% | −1.01 (0.36) | <.001 |
| Neutrophil ≤ 5% | −0.33 (0.72) | .58 |
| Neutrophil ≤ 6.2% | 0.09 (1.09) | <.001 |
| Neutrophil ≤ 10% | −0.24 (0.79) | .058 |
Seventy‐nine particulate exposure measurements were obtained (Figure 1). All horses were housed on the grounds of the racing facility, were bedded on loose sawdust obtained from various distributors, and fed dry alfalfa hay, also obtained from various distributors. All horses were confined to 12′ × 12′ box stalls with a hinged, yoked, half‐size stall gate that allowed horses to extend head and neck into the barn aisle. Three types of barn construction were present: enclosed (with stalls arranged either side of a single aisle, type 1), shed row (with stalls arranged back‐to‐back, perimeter aisles, and partial fabric walls, type 2), and clear span (with stalls arranged in two shed rows on either side of a central aisle, under a single roof, surrounded by a perimeter aisle with open sidewalls, type 3). Fifty‐six (71%) particulate measures were obtained when horses were fed hay from the ground inside the stall, while 23 (29%) were obtained when hay was fed from a hay net hanging outside the stall. Exposures measured at the breathing zone are summarized in Table 3. Respirable dust exposure varied significantly horse‐to‐horse (P < .001), but was not affected by trainer (P = .087, Supporting Information Figure S1), barn construction (P = .68, Supporting Information Figure S2), or method of feeding (P = .76, Supporting Information Figure S3). Conversely, inhalable dust exposure was significantly affected by trainer (P < .001, Supporting Information Figure S4), barn construction (P = .0010, Supporting Information Figure S5), and method of hay feeding (P = .026, Supporting Information Figure S6), and random variation because of horse (P < .001). Both endotoxin and β‐glucan exposure varied significantly between trainers (P <.001), caused by significantly higher endotoxin exposure measurements under trainer 2 and higher β‐glucan exposures under the management of trainer 3 (Supporting Information Figures S7 and S8, respectively). Endotoxin exposures were not different when horses were fed from a hay net or from the ground (P = .061, Supporting Information Figure S9).
Table 3.
Summary statistics of breathing zone exposure measurements
| N | Mean ± SD | Median | Range | |
|---|---|---|---|---|
| Respirable Dust (mg/m3) | 79 | 0.090 ± 0.24 | 0.031 | <0.02a–1.97 |
| Inhalable Dust (mg/m3) | 79 | 1.28 ± 1.79 | 0.31 | <0.02a–10.2 |
| Endotoxin (EU/m3) | 67 | 7.35 ± 12.8 | 2.35 | 0.18–87.7 |
| β‐glucan (pg/m3) | 66 | 55.5 ± 66.2 | 32.9 | 1.44–351 |
Abbreviation: N, number of samples; SD, standard deviation.
Gravimetric limit of detection = 0.02 mg/m3.
Bronchoalveolar lavage fluid mast cell proportions were found to increase significantly with β‐glucan exposure (P = .030, Figure 5). Respirable dust and endotoxin exposures did not significantly affect mast cell proportions (P =.97 and .95 respectively, Table 4). The interaction term between respirable dust and endotoxin exposures was not significant (P =.12), and did not change interpretation of the model and so was not included. The random effect of horse was statistically significant (P < .001).
Figure 5.
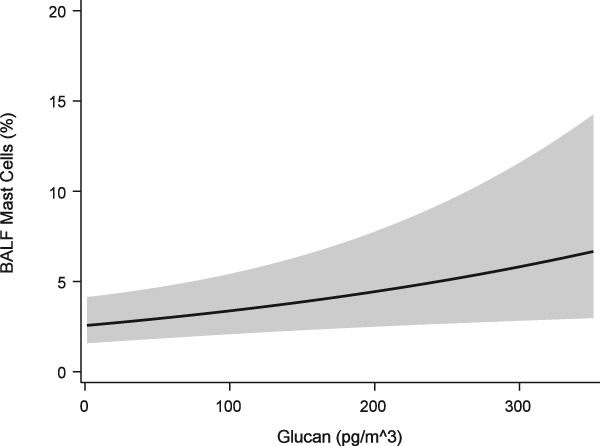
Generalized linear mixed model of BALF mast cell proportions versus respirable β‐glucan exposure. Solid line = predicted mean response fit at age = 4.02 years, inhalable dust = 1.30 mg/m3, endotoxin = 5.97 EU/m3, respirable dust = .01 mg/m3, trainer = 8. Band = 95% confidence interval of the mean response
Table 4.
Mixed model of inflammatory cell proportions versus exposure parameters (n = 66)
| Outcome | Variable | Estimate (Factor Change per unit increase) | P‐value |
|---|---|---|---|
| Mast Cell Proportions | Respirable Dust (mg/m3) | −0.032 (.97) | .93 |
| Inhalable Dust (mg/m3) | 0.048 (1.05) | .60 | |
| Endotoxin (EU/m3) | 0.0011 (1.00) | .93 | |
| β‐glucan (100 pg/m3) | 0.0028 (1.3) | .030 | |
| Age (year) | −0.13 (0.87) | .099 | |
| Neutrophil Proportions | Respirable Dust (0.1 mg/m3) | 6.24 (1.3) | .015 |
| Inhalable Dust (mg/m3) | −0.17 (0.85) | .34 | |
| Endotoxin (EU/m3) | 0.045 (1.05) | .056 | |
| β‐glucan (100 pg/m3) | 0.0018 (1.2) | .44 | |
| Age (year) | −0.088 (0.92) | .42 | |
| Endotoxin*Respirable Dust (interaction term) | −0.58 (0.56) | .043 |
Neutrophil proportions in BALF were found to be positively associated with increasing respirable dust exposure (P = .0095, Figure 6). An interaction term between respirable endotoxin and respirable dust exposure resulted in a significant change in the parameter estimate for respirable dust (1.08 versus 1.3‐fold increase in neutrophil proportions with each 0.1 mg/m3 increase in exposure, Figure 7, Table 4). While the respirable dust effect size increased with the inclusion of the interaction between respirable dust and endotoxin, the effect of the interaction itself resulted in 35% reduction in neutrophil proportions (ie, 0.65* neutrophil %) for each EU/m3 increase in endotoxin exposure (Figure 8).
Figure 6.
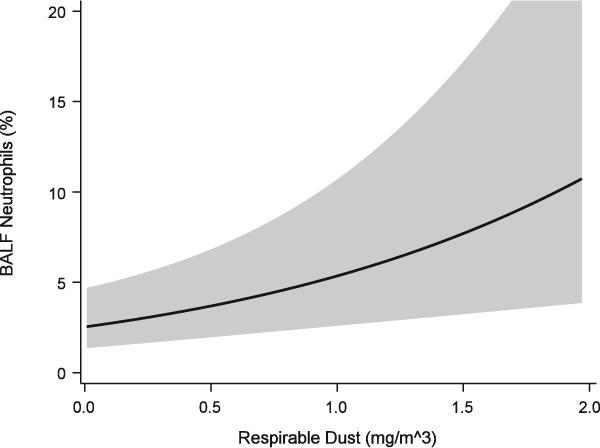
Generalized linear mixed model of BALF neutrophil proportions versus respirable dust exposure. Solid line = predicted mean response fit at age = 4.02 years, inhalable dust = 1.30 mg/m3, endotoxin = 5.97 EU/m3, β‐glucan = 59.02 pg/m3, trainer = 8. Band = 95% confidence interval of the mean response
Figure 7.
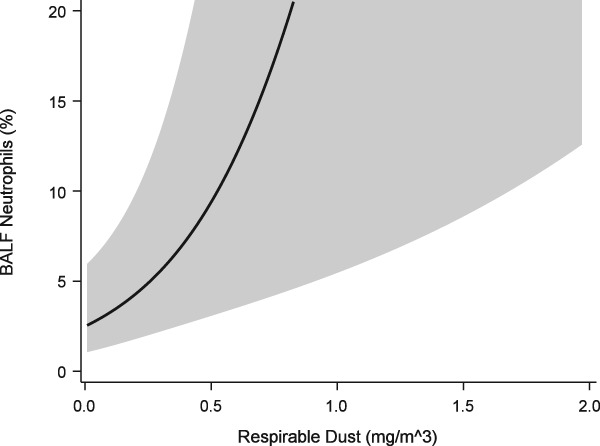
Generalized linear mixed model of BALF neutrophil proportions versus respirable dust exposure that includes interaction term between respirable dust and endotoxin exposures and over dispersion component
Figure 8.
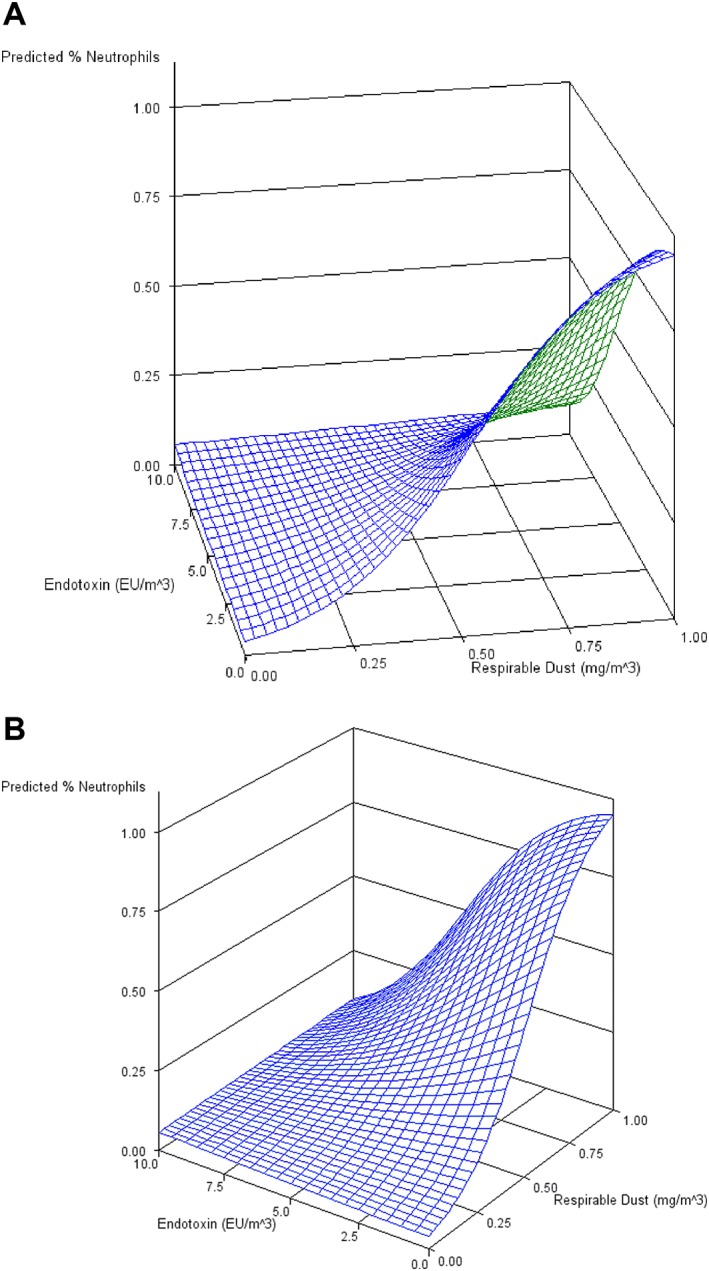
Surface plot of mean neutrophil response to respirable dust and endotoxin exposures (A) and after 45 degrees plot rotation (B). See Figure 6 for levels of covariates at which response was calculated
Trainer and inhalable dust exposures were found to have no significant effect on either neutrophil (P = .60 and .34, respectively) or mast cell proportions (P = .74 and .60, respectively).
4. DISCUSSION
In otherwise healthy racing TBs, mastocytic airway inflammation significantly impairs performance, reducing both indices of speed and the likelihood of winning in a dose‐dependent manner. Neutrophilic airway inflammation also negatively impacts performance, though to a lesser degree. Respirable dust and β‐glucan exposures appear to be important determinants in the type and degree of airway inflammation.
Equine asthma appears to be highly prevalent in racing Thoroughbreds. In this study, mast cell inflammation was most common, with over half of the study population exhibiting >2% mast cells in BALF. In contrast to young horses entering training (age <36 months),7 eosinophilic inflammation was rare in this population (4.0 years ±1.4 years). Such high disease prevalence based on BALF cytology is consistent with a previous study reporting that 129 of 138 clinically healthy racehorses exhibited increased inflammatory cell proportions when using the consensus definition.1, 25
As hypothesized, racing performance was negatively impacted by lower airway inflammation, with mast cells having the greatest apparent effect upon the speed of the horse. Similar to the effect on the speed figure, mast cell inflammatory cell proportions were found to influence the likelihood of winning: the likelihood of finishing first dropped 9% with each 1% increase in the mast cell proportion. Neutrophil cell proportions did not significantly affect the likelihood of winning, further corroborating the stronger effect of mast cells upon performance. This prospective field study investigated the association between BALF cytology and performance using airway samples collected ∼1 hour after racing. Previous studies have compared BALF cytology between good and poor performers categorized retrospectively based on race placings in previous months and collected airway samples days to weeks after the last race.8, 26, 27, 28 In the current study, the close temporal association between racing and collection of BALF, the dose‐response relationship, and the magnitude of the effect suggest strongly that mild equine asthma is deleterious to performance.
The relationships demonstrated between performance and BALF inflammatory cell proportions support a continuous effect of both mast cells and neutrophils upon performance, rather than suggesting any threshold value. However, modeling the probability of winning upon differing case definitions does suggest appropriate cut‐offs likely to be pertinent to racing performance in Thoroughbreds. In this population, horses with BALF mast cell ≤ 2% were 1.5 times more likely to win. When this threshold was moved to 2.6%, the upper reference limit suggested by the study population of well‐performing horses, horses were 1.8 times more likely to win. Using a threshold of ≤5%, horses were actually less likely to win than those with >5%; however, only 6 observations were available from the latter group. Taken together, these data suggest an appropriate threshold for mast cell inflammation between 2 and 3%. Similarly, horses with BALF neutrophil proportions ≤ 6.2% were significantly more likely to win, although the effect was modest with <10% increase. The fact that this effect was nonsignificant for cut points of 5 and 10% suggests the threshold for performance‐relevant neutrophilic inflammation lies closer to the 6.2% defined as the upper limit of “normal” in the current study. Other investigators have suggested using higher thresholds for diagnosing neutrophilic or mastocytic inflammation because of a concern that too many horses would be categorized as “abnormal.”8 Results from our study support the case definition of mild equine asthma and healthy control population with neutrophils ≤5% and mast cells ≤2% as recommended in the 2016 ACVIM consensus statement.1 In the evaluation of BALF cytology from individual horses, our data suggest that performance with a BALF mast cell proportion of 4%, for example, is likely to be reduced by 6 speed figure points when compared to the performance of the same horse with a BALF mast cell proportion of 2%.
In our study, mean breathing zone respirable dust levels (0.089 mg/m3) were generally comparable to those levels reported in conventional equine management systems when horses were fed dry hay (0.064 mg/m3),29 and lower than those reported under low‐dust management when horses were fed haylage (0.22 mg/m3).11 The range of measurements was large (∼100‐fold difference between lowest and highest readings) but consistent with a previous study in thoroughbred racehorses and likely affected by individual horse behavior.7 The median respirable dust exposure (0.031 mg/m3) was also similar to that measured in the breathing zone of young TBs fed hay from the ground (0.055 mg/m3). In that study, feeding hay from a net inside the stall increased respirable dust exposures 4‐fold,7 but respirable dust exposure did not differ between those fed hay from the ground and those fed from a net in the current study. This difference is likely because of the fact that hay nets were hung outside the stall rather than inside the stall, so horses in the current study were unable to bury their muzzles directly in the hay. Additionally, hanging the net outside the stall likely resulted in those horses spending more time with their heads outside the stall, though this variable was not measured. Despite relatively low dust exposure levels, results from this study demonstrated a highly significant effect of respirable dust exposure upon BALF neutrophil proportions. For each 0.1 mg/m3 increase in respirable dust exposure, the proportion of neutrophils is predicted to increase by a factor of 1.3. This finding is in agreement with the observation of considerable BALF neutrophilia in otherwise healthy horses exposed to high dust levels during moldy hay challenges,14, 15, 30, 31, 32 with reported median respirable dust exposures ranging from 0.133 to 0.5 mg/m3.31 Though inhalable dust concentrations varied with trainer and barn construction, respirable dust exposures did not. Management between trainers was similar, with all horses fed dry hay, bedded on sawdust, and fed the same textured sweet feed (Performance Advantage, Tribute Equine Nutrition, Upper Sandusky, Ohio). These data suggest that exposure to larger dust particles is more easily influenced by barn construction and variations in dry hay than respirable dust exposure. The fact that airway neutrophilia occurs at levels that are relevant to performance even in “low dust” environments highlights the need for better understanding of intrinsic (horse related) and extrinsic factors responsible for such response, as well as the need for appropriate interventions such as lower dust forages and other management practices to reduce exposure.
The apparent protective effect of endotoxin at the levels encountered in the relatively low dust environment of our study is surprising and complex. When the interaction is ignored, the estimated effect size of respirable dust exposure is much smaller than when it is included in the model, but this larger effect size is tempered as endotoxin exposures increase. The median endotoxin exposure (2.2 EU/m3) in our study was lower than those previously reported for horses bedded on sawdust and fed dry hay from the ground (59.2 EU/m3),7 and were drastically lower than those reported for horses bedded on straw (from 5559 to 7080 EU/m3).12, 34 Trainer significantly affected endotoxin exposure, with Trainer 2 demonstrating significantly higher mean endotoxin levels (87.7 EU/m3) than the other trainers (<10 EU/m3). The reason for this difference is not clear, but even this higher exposure level is likely to be significantly less than those reported to augment airway inflammation in the horse, though direct comparison is not possible because of differences in reporting and sample processing. There is a synergistic effect between endotoxin and respirable dust at experimental endotoxin doses of 48 000 EU.33 At an exposure level of 87.7 EU/m3, and assuming a resting minute ventilation of 78 L/min, a dose of 48 000 EU would take nearly 5 days to achieve. In the same report, the response to two environments was compared, and horses developed greater neutrophilic inflammation after confinement to the stable with lower endotoxin concentrations (3.6 ng/m3, ≈36 EU/m3 versus 6.9 ng/m3, ≈69 EU/m3),33 suggesting that a similar attenuation of inflammation may have occurred. Taken with the pro‐inflammatory effects demonstrated upon larger experimental exposures in horses, these data suggest that the relationship between endotoxin exposure and the magnitude of neutrophilic response may not be linear as suggested.33
A statistically significant but modest effect of β‐glucan exposure upon BALF mast cell proportions was demonstrated, suggesting a potential hypersensitivity to fungal exposure. If hypersensitivity to specific fungal allergens is responsible for this statistical observation, the small effect size of 1.3‐fold increase in the mast cell proportion with each 100 pg/m3 increase in β‐glucan exposure might simply reflect that this is a crude measure of overall fungal exposure, and plant and bacterial material can also contribute to β‐glucan levels.35 Similar to endotoxin exposures, β‐glucan exposures were affected by trainer caused by significantly higher mean concentrations measured under the management of trainer 3 (351 pg/m3) compared to all other trainers (<90 pg/m3), possibly because of poor quality hay based upon visual inspection.
This prospective field study evaluated the effect of mild to moderate equine asthma upon racing performance as defined by BALF cytology. While both cell types had a significant effect on racing performance, the effect of mast cells was found to be roughly twice that of neutrophils. Our findings support the clinical impression that mast cell inflammation is more common in younger horses. Additionally, our data support the hypothesis that differing cytologic phenotypes likely reflect different disease processes with differing etiology, predisposing factors, and consequences. Finally, results of this study suggest that respirable dust exposure is a more relevant measure than inhalable dust when evaluating respiratory health in horses.
CONFLICT OF INTEREST DECLARATION
Dr Moore serves as Consulting Editor for Experimental Design and Statistics for the Journal of Veterinary Internal Medicine. He was not involved in review of this manuscript.
OFF‐LABEL ANTIMICROBIAL DECLARATION
No off‐label antimicrobial use occurred.
INSTITUTIONAL ANIMAL CARE AND USE COMMITTEE (IACUC) OR OTHER APPROVAL DECLARATION
The Purdue University Animal Care and Use Committee and the Indiana Horse Racing Commission approved all procedures.
Supporting information
Figure S1. Least square mean respirable dust concentrations for each trainer with 95% confidence limits. No exposure measurements were available for trainer 6.
Figure S2. Least square mean respirable dust concentrations for each type of barn construction with 95% confidence limits. No exposure measurements were available for trainer 6.
Figure S3. Least square mean respirable dust concentrations for method of feeding hay with 95% confidence limits. No exposure measurements were available for trainer 6.
Figure S4. Least square mean inhalable dust concentrations for each trainer with 95% confidence limits. No exposure measurements were available for trainer 6.
Figure S5. Least square mean inhalable dust concentrations for each type of barn construction with 95% confidence limits. 1: enclosed with stalls arranged either side of a single aisle; 2: shed row with stalls arranged back‐to‐back, perimeter aisles, and partial fabric walls; 3: clear span with stalls arranged in two shed rows on either side of a central aisle, under a single roof, surrounded by a perimeter aisle with open sidewalls. No exposure measurements were available for trainer 6.
Figure S6. Least square mean inhalable dust concentrations for method of feeding hay with 95% confidence limits. No exposure measurements were available for trainer 6.
Figure S7. Least square mean endotoxin concentrations for each trainer with 95% confidence limits. No exposure measurements were available for trainer 6.
Figure S8. Least square mean β‐glucan concentrations for each trainer with 95% confidence limits. No exposure measurements were available for trainer 6.
Figure S9. Least square mean endtoxin concentrations for method of feeding hay with 95% confidence limits. No exposure measurements were available for trainer 6.
Table S1. Clinical scoring system adapted from Tesarowski et al., 1996.
ACKNOWLEDGMENTS
The authors thank Donna Griffey, Dr. Katie Naughton, Dr. Lisa Hepworth, Rycal Blount, Bill Blumberg, Michael Brown, Ashlyn Duckwall, Marissa Goodwin, Andrea Hall, Alisa Herbst, Haley Jost, Lauren Kerestes, Ines Likon, Kyle Martin, Luiza Placheta, Alexa Phillips, Gabrielle Weinert, Erin Yanoviak, Sarah Zalar and Kylie Zehner for technical and administrative assistance. This study would not have been possible without the support of many horse owners, trainers, veterinarians, and track personnel, thank you. The work presented in this manuscript was performed at the Purdue University College of Veterinary Medicine and Indiana Grand Racing and Casino racetrack. This study was supported by the Grayson‐Jockey Club Research Foundation, the state of Indiana and PVM research account funded by the total wager tax, and the USDA National Institute of Food and Agriculture, Animal Health project IND020767AH. Portions of the results included in this manuscript were presented at the 2017 World Equine Airways Symposium and the 2017 Veterinary Comparative Respiratory Society Symposium.
Ivester KM, Couëtil LL, Moore GE. An observational study of environmental exposures, airway cytology, and performance in racing thoroughbreds. J Vet Intern Med. 2018;32:1754–1762. 10.1111/jvim.15226
Funding information Grayson‐Jockey Club Research Foundation; the state of Indiana and PVM research account funded by the total wager tax; USDA National Institute of Food and Agriculture; Animal Health project, Grant/Award Number: IND020767AH
References
- 1. Couëtil LL, Cardwell JM, Gerber V, Lavoie JP, Léguillette R, Richard EA. Inflammatory airway disease of horses—revised consensus statement. JVet Intern Med. 2016;30(2):503–515. [DOI] [PMC free article] [PubMed] [Google Scholar]
- 2. Holcombe SJ, Robinson NE, Derksen FJ, et al. Effect of tracheal mucus and tracheal cytology on racing performance in Thoroughbred racehorses. Equine Vet J. 2006;38:300–304. [DOI] [PubMed] [Google Scholar]
- 3. Beekman L, Tohver T, Leguillette R. Comparison of cytokine mRNA expression in the bronchoalveolar lavage fluid of horses with inflammatory airway disease and bronchoalveolar lavage mastocytosis or neutrophilia using REST software analysis. JVet Intern Med. 2012;26:153–161. [DOI] [PubMed] [Google Scholar]
- 4. Lavoie JP, Cesarini C, Lavoie‐Lamoureux A, et al. Bronchoalveolar lavage fluid cytology and cytokine messenger ribonucleic Acid expression of racehorses with exercise intolerance and lower airway inflammation. JVet Intern Med. 2011;25:322–329. [DOI] [PubMed] [Google Scholar]
- 5. Bedenice D, Mazan MR, Hoffman AM. Association between cough and cytology of bronchoalveolar lavage fluid and pulmonary function in horses diagnosed with inflammatory airway disease. JVet Intern Med. 2008;22:1022–1028. [DOI] [PubMed] [Google Scholar]
- 6. Hare JE, Viel L. Pulmonary eosinophilia associated with increased airway responsiveness in young racing horses. JVet Intern Med. 1998;12:163–170. [DOI] [PubMed] [Google Scholar]
- 7. Ivester KM, Couëtil LL, Moore GE, Zimmerman NJ, Raskin RE. Environmental exposures and airway inflammation in Young Thoroughbred Horses. JVet Intern Med. 2014;28:918–924. [DOI] [PMC free article] [PubMed] [Google Scholar]
- 8. Richard EA, Fortier GD, Lekeux PM, Van Erck E. Laboratory findings in respiratory fluids of the poorly‐performing horse. Vet J. 2010;185:115–122. [DOI] [PubMed] [Google Scholar]
- 9. Allen KJ, Tremaine WH, Franklin SH. Prevalence of inflammatory airway disease in national hunt horses referred for investigation of poor athletic performance. Equine Vet J. 2006;38:529–534. [DOI] [PubMed] [Google Scholar]
- 10. Nolen‐Walston RD, Harris M, Agnew ME, et al. Clinical and diagnostic features of inflammatory airway disease subtypes in horses examined because of poor performance: 98 cases (2004–2010). JAm Vet Med Assoc. 2013;242:1138–1145. [DOI] [PubMed] [Google Scholar]
- 11. McGorum BC, Ellison J, Cullen RT. Total and respirable airborne dust endotoxin concentrations in three equine management systems. Equine Vet J 1998;30:430–434. [DOI] [PubMed] [Google Scholar]
- 12. Berndt A, Derksen FJ, Edward Robinson N. Endotoxin concentrations within the breathing zone of horses are higher in stables than on pasture. Vet J. 2010;183:54–57. [DOI] [PubMed] [Google Scholar]
- 13. Holcombe SJ, Jackson C, Gerber V, et al. Stabling is associated with airway inflammation in young Arabian horses. Equine Vet J. 2001;33:244–249. [DOI] [PubMed] [Google Scholar]
- 14. Tremblay GM, Ferland C, Lapointe JM, Vrins A, Lavoie JP, Cormier Y. Effect of stabling on bronchoalveolar cells obtained from normal and COPD horses. Equine Vet J. 1993;25:194–197. [DOI] [PubMed] [Google Scholar]
- 15. Gerber V, Lindberg A, Berney C, Robinson NE. Airway mucus in recurrent airway obstruction–short‐term response to environmental challenge. JVet Int Med. 2004;18:92–97. [DOI] [PubMed] [Google Scholar]
- 16. Robinson NE, Berney C, Eberhart S, et al. Coughing, mucus accumulation, airway obstruction, and airway inflammation in control horses and horses affected with recurrent airway obstruction. Am J Vet Res. 2003;64:550–557. [DOI] [PubMed] [Google Scholar]
- 17. Millerick‐May ML, Karmaus W, Derksen FJ, Berthold B, Holcombe SJ, Robinson NE. Local airborne particulate concentration is associated with visible tracheal mucus in Thoroughbred racehorses. Equine Vet J. 2013;45:85–90. [DOI] [PubMed] [Google Scholar]
- 18. Ivester KM, Smith K, Moore GE, Zimmerman NJ, Couëtilt LL. Variability in particulate concentrations in a horse training barn over time. Equine Vet J. 2012;44:51–56. [DOI] [PubMed] [Google Scholar]
- 19. Plevin S, McLellan J. The effect of insertional suspensory branch desmitis on racing performance in juvenile Thoroughbred racehorses. Equine Vet J. 2014;46:451–457. [DOI] [PubMed] [Google Scholar]
- 20. Tesarowski DB, Viel L, McDonell WN. Pulmonary function measurements during repeated environmental challenge of horses with recurrent airway obstruction (heaves). Am J Vet Res. 1996;57:1214–1219. [PubMed] [Google Scholar]
- 21. Raker CW, Boles CL. Pharyngeal lymphoid hyperplasia in the horse. JEq Med Surg. 1978;202–207. [Google Scholar]
- 22. Rakestraw PC, Hackett RP, Ducharme NG, Nielan GJ, Erb HN. Arytenoid cartilage movement in resting and exercising horses. Vet Surg. 1991;20:122–127. [DOI] [PubMed] [Google Scholar]
- 23. Gerber V, Straub R, Marti E, et al. Endoscopic scoring of mucus quantity and quality: observer and horse variance and relationship to inflammation, mucus viscoelasticity and volume. Equine Vet J. 2004;36:576–582. [DOI] [PubMed] [Google Scholar]
- 24. Hinchcliff KW, Jackson MA, Brown JA, et al. Tracheobronchoscopic assessment of exercise‐induced pulmonary hemorrhage in horses. Am J Vet Res. 2005;66:596–598. [DOI] [PubMed] [Google Scholar]
- 25. Depecker M, Richard EA, Pitel PH, Fortier G, Leleu C, Couroucé‐Malblanc A. Bronchoalveolar lavage fluid in Standardbred racehorses: Influence of unilateral/bilateral profiles and cut‐off values on lower airway disease diagnosis. Vet J. 2014;199(1):150–156. [DOI] [PubMed] [Google Scholar]
- 26. Fogarty U, Buckley T. Bronchoalveolar lavage findings in horses with exercise intolerance. Equine Vet J. 1991;23:434–437. [DOI] [PubMed] [Google Scholar]
- 27. Moore BR, Krakowka S, Robertson JT, Cummins JM. Cytologic evaluation of bronchoalveolar lavage fluid obtained from standardbred racehorses with inflammatory airway disease. Am J Vet Res. 1995;56:562–567. [PubMed] [Google Scholar]
- 28. Couetil LL, Denicola DB. Blood gas, plasma lactate and bronchoalveolar lavage cytology analyses in racehorses with respiratory disease. Equine Vet J. 1999;31:77–82. [DOI] [PubMed] [Google Scholar]
- 29. Clements JM, Pirie RS. Respirable dust concentrations in equine stables. Part 1: Validation of equipment and effect of various management systems. Res Vet Sci. 2007;83:256–262. [DOI] [PubMed] [Google Scholar]
- 30. Leclere M, Lavoie‐Lamoureux A, Gelinas‐Lymburner E, David F, Martin JG, Lavoie JP. Effect of antigenic exposure on airway smooth muscle remodeling in an equine model of chronic asthma. Am J Respir Cell Mol Biol. 2011;45:181–187. [DOI] [PubMed] [Google Scholar]
- 31. Pirie RS, Dixon PM, Collie DD, McGorum BC. Pulmonary and systemic effects of inhaled endotoxin in control and heaves horses. Equine Vet J. 2001;33:311–318. [DOI] [PubMed] [Google Scholar]
- 32. Desjardins I, Theoret C, Joubert P, Wagner B, Lavoie JP. Comparison of TGF‐beta 1 concentrations in bronchoalveolar fluid of horses affected with heaves and of normal controls. Vet Immunol Immunopathol. 2004;101:133–141. [DOI] [PubMed] [Google Scholar]
- 33. Pirie RS, Collie DD, Dixon PM, McGorum BC. Inhaled endotoxin and organic dust particulates have synergistic proinflammatory effects in equine heaves (organic dust‐induced asthma). Clin Exp Allergy. 2003;33:676–683. [DOI] [PubMed] [Google Scholar]
- 34. Samadi S, Wouters IM, Houben R, Jamshidifard AR, Van Eerdenburg F, Heederik DJ. Exposure to inhalable dust, endotoxins, beta(1‐>3)‐glucans, and airborne microorganisms in horse stables. Ann Occup Hyg. 2009;53:595–603. [DOI] [PubMed] [Google Scholar]
- 35. Rylander R. Indoor air‐related effects and airborne (1 –> 3)‐beta‐D‐glucan. Environ Health Perspect. 1999;107 Suppl 3:501–503. [DOI] [PMC free article] [PubMed] [Google Scholar]
Associated Data
This section collects any data citations, data availability statements, or supplementary materials included in this article.
Supplementary Materials
Figure S1. Least square mean respirable dust concentrations for each trainer with 95% confidence limits. No exposure measurements were available for trainer 6.
Figure S2. Least square mean respirable dust concentrations for each type of barn construction with 95% confidence limits. No exposure measurements were available for trainer 6.
Figure S3. Least square mean respirable dust concentrations for method of feeding hay with 95% confidence limits. No exposure measurements were available for trainer 6.
Figure S4. Least square mean inhalable dust concentrations for each trainer with 95% confidence limits. No exposure measurements were available for trainer 6.
Figure S5. Least square mean inhalable dust concentrations for each type of barn construction with 95% confidence limits. 1: enclosed with stalls arranged either side of a single aisle; 2: shed row with stalls arranged back‐to‐back, perimeter aisles, and partial fabric walls; 3: clear span with stalls arranged in two shed rows on either side of a central aisle, under a single roof, surrounded by a perimeter aisle with open sidewalls. No exposure measurements were available for trainer 6.
Figure S6. Least square mean inhalable dust concentrations for method of feeding hay with 95% confidence limits. No exposure measurements were available for trainer 6.
Figure S7. Least square mean endotoxin concentrations for each trainer with 95% confidence limits. No exposure measurements were available for trainer 6.
Figure S8. Least square mean β‐glucan concentrations for each trainer with 95% confidence limits. No exposure measurements were available for trainer 6.
Figure S9. Least square mean endtoxin concentrations for method of feeding hay with 95% confidence limits. No exposure measurements were available for trainer 6.
Table S1. Clinical scoring system adapted from Tesarowski et al., 1996.